The National Stock Exchange (NSE) regularly witnesses equity turnover exceeding ₹80,000 crores on an average trading day. Behind each price movement lies a constant negotiation between buyers and sellers, where supply and demand are tested in real time. Price action trading interprets these negotiations directly on the chart. It avoids oscillators, moving averages, or hidden algorithms, which makes it one of the most direct yet challenging approaches available to Indian traders.
In the Indian equity landscape, price action trading has gained increasing popularity amongst both retail traders and professional market participants. Its appeal lies in its simplicity: it removes chart clutter and helps the trader concentrate on the essential story that the price itself is narrating. This clarity proves particularly useful in India’s dynamic environment, where markets often react sharply to factors such as monsoon forecasts, Reserve Bank of India (RBI) announcements, or shifts in global sentiment.
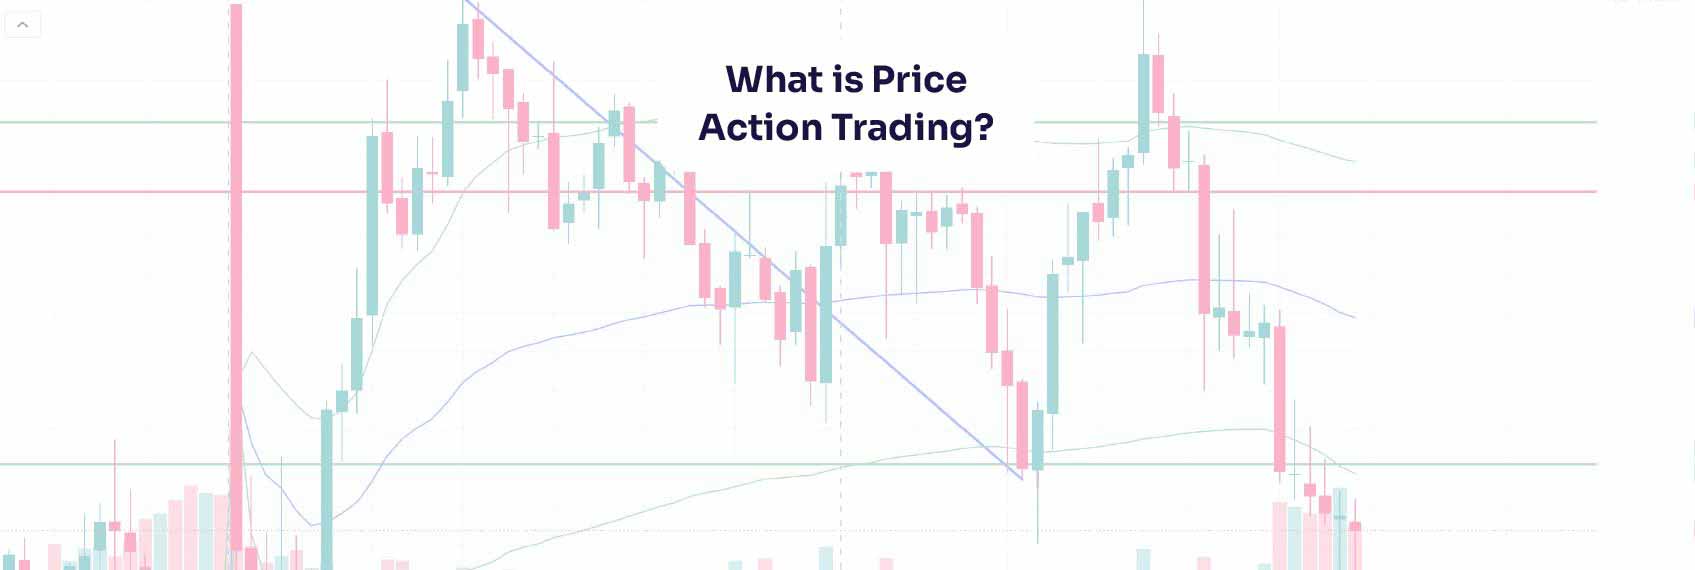
The study of price movements without reliance on lagging indicators is known as price action trading. To predict possible shifts in direction, traders track swings, highs, lows, and closing levels. This method is regarded as a straightforward yet effective area of technical analysis since it solely uses first-hand market data.
This method typically rests upon four core observations:
Many different types of Indian market participants are drawn to price action trading. In Bank Nifty futures and options, proprietary trading desks search for fast signals. Retail positional traders also use this approach to monitor mid-cap and small-cap momentum with clearer charts.
Intraday scalpers in highly liquid counters such as HDFC Bank or ICICI Bank, who depend on candlestick accuracy, are another category of participants attracted to price action trading. Arbitrageurs, who closely watch sudden price changes between the cash and futures markets, also find it valuable. Swing traders rely on daily or weekly chart structures and typically hold trades for several days or weeks. Institutional fund managers often use price action as a supplementary tool to time significant entries or exits.
The versatility of price action trading allows the same methodology to be adapted across different time horizons. A five-minute chart may guide an intraday scalper, while a monthly chart may assist a long-term investor in refining entry levels.
Traditional technical analysis often overlays numerous indicators such as RSI, MACD, Bollinger Bands, and moving averages. While these tools provide value, they can delay decision-making because many are lagging by nature. Price action trading, on the other hand, studies the raw chart without such overlays.
Comparison:
The advantage of price action is immediacy and clarity. When a market shifts, the evidence appears first in its candles and levels. Indicators usually confirm after the move has already begun.
Implementing price action trading requires a structured approach. A six-step process often works best:
| 1 | Analyse market context | Study broader indices such as Nifty 50 or Bank Nifty to understand the prevailing trend. |
| 2 | Mark supply and demand zones | Highlight areas where price has repeatedly reacted, such as Nifty 18,000 or Bank Nifty 45,000. |
| 3 | Wait for patterns | Avoid premature entries; allow formations like pin bars, engulfing patterns, or inside bars to develop. |
| 4 | Define entries | Place buy or sell triggers above or below significant candles or at breakout points. |
| 5 | Set stop-losses | Always protect capital by defining levels where the initial trade thesis becomes invalid. |
| 6 | Fix targets | Aim for opposing supply or demand zones, or use measured moves to determine reasonable exits. |
The balance between supply and demand forms the foundation of all price action analysis.
These zones are most effective when they are fresh and untested. Repeated testing weakens their reliability. On the NSE, explosive range candles often accompany such zones, reflecting institutional buying or selling pressure during major events.
Modern trading platforms provide advanced tools for identifying patterns:
Important recognition factors include confirmation with above-average volume, visibility across multiple timeframes, and proximity to major levels.
Several patterns form the language of price action trading. Each carries specific implications:
The reliability of these patterns improves with higher trading volume, alignment across timeframes, and significance of the underlying levels.
For Indian market participants, price action trading offers a systematic yet simple approach. Traders may understand the market's story without the hindrance of outside indicators by concentrating solely on price behaviour. The same concepts of supply-demand analysis, candlestick recognition, and disciplined risk management apply whether trading individual stocks, the Nifty, or the Bank Nifty.
Its strength is in response rather than prediction. When the market reveals its hand, a disciplined trader reacts with well-defined entries, protective stops, and reasonable targets. This creates consistency over time.
The advantages are obvious for Indian traders. Price action is a useful and universal tool in a market that is subject to abrupt policy announcements, world events, or liquidity-driven movements. Traders can use price action as a basis for more assured and reliable results in their market journey if they are patient, practise consistently, and prioritise risk management.
T+1 And T+2 Settlement Explained: Meaning, Impact And Holiday Rules
5 min Read May 29, 2026
Stocks to buy for long term: HDFC Bank, HCC among 8 stocks Ventura's Vinit Bolinjkar suggests for 18-115% gains
5 min Read May 29, 2026
Why asset allocation matters more than stock picking in 2026
5 min Read May 29, 2026
Are defence funds overvalued after a 25% rally? What investors must know
5 min Read May 27, 2026
Is this the right time to enter the stock market? Or should you wait?
5 min Read May 26, 2026


For android only