The world of options trading is filled with technical indicators and chart patterns that can help traders make informed decisions. Among these patterns, the symmetrical triangle stands out for its simplicity and effectiveness in identifying potential breakouts. This blog delves into the world of symmetrical triangles in options trading, explaining its formation, interpretation, and trading strategies for both calls and puts.
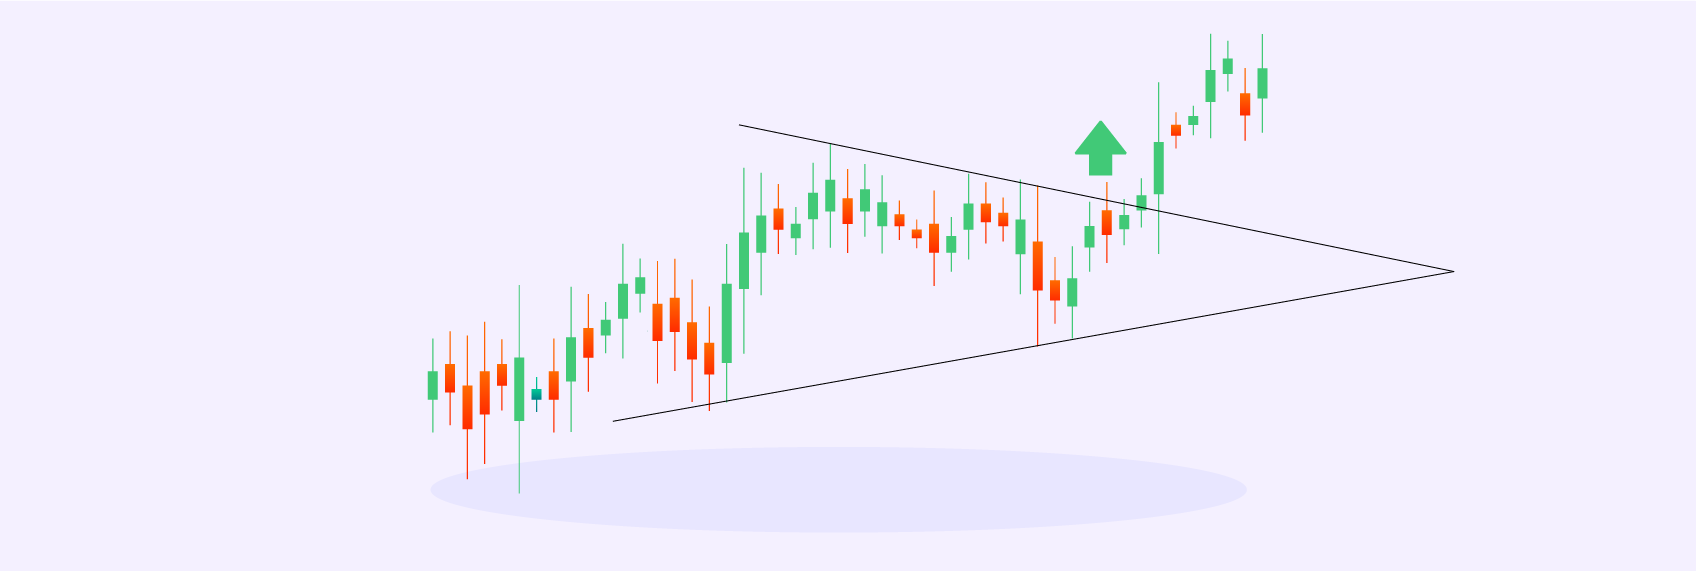
Imagine two converging trend lines, one sloping upwards and the other downwards, forming a triangular shape. This is the essence of a symmetrical triangle. The price action of the underlying asset gets compressed within these converging trend lines, creating a period of consolidation.
The key element of the symmetrical triangle is the breakout, which signifies a decisive move by either buyers or sellers. Here's how to interpret the breakout:
Once you identify a symmetrical triangle, here are some options trading strategies to consider:
It's important to remember that no technical indicator is foolproof. Here are some limitations to consider:
The symmetrical triangle is a valuable tool for options traders, helping identify potential breakouts and make informed decisions. However, it should be used in conjunction with other technical indicators and fundamental analysis for a more robust trading strategy. By understanding its formation, interpretation, and limitations, you can leverage the power of the symmetrical triangle to enhance your options trading experience. Remember, consistent practice, risk management, and a healthy dose of scepticism are key ingredients for success in the options market.

Year end and the Tax Harvesting Ritual
2 min Read Mar 27, 2026
Market Volatility and Multi Asset Funds
2 min Read Mar 27, 2026
What are the 4 types of fossil fuels: how do they matter for investors?
2 min Read Mar 23, 2026
Old vs New Tax Regime: ₹20 Lakh Income Can Save You Over ₹1 Lakh
2 min Read Mar 20, 2026
Commodity trading in India: a closer look
2 min Read Mar 20, 2026
For android only