The world of options trading is filled with technical indicators and chart patterns that can help traders make informed decisions. Among these patterns, the symmetrical triangle stands out for its simplicity and effectiveness in identifying potential breakouts. This blog delves into the world of symmetrical triangles in options trading, explaining its formation, interpretation, and trading strategies for both calls and puts.
What is the symmetrical triangle?
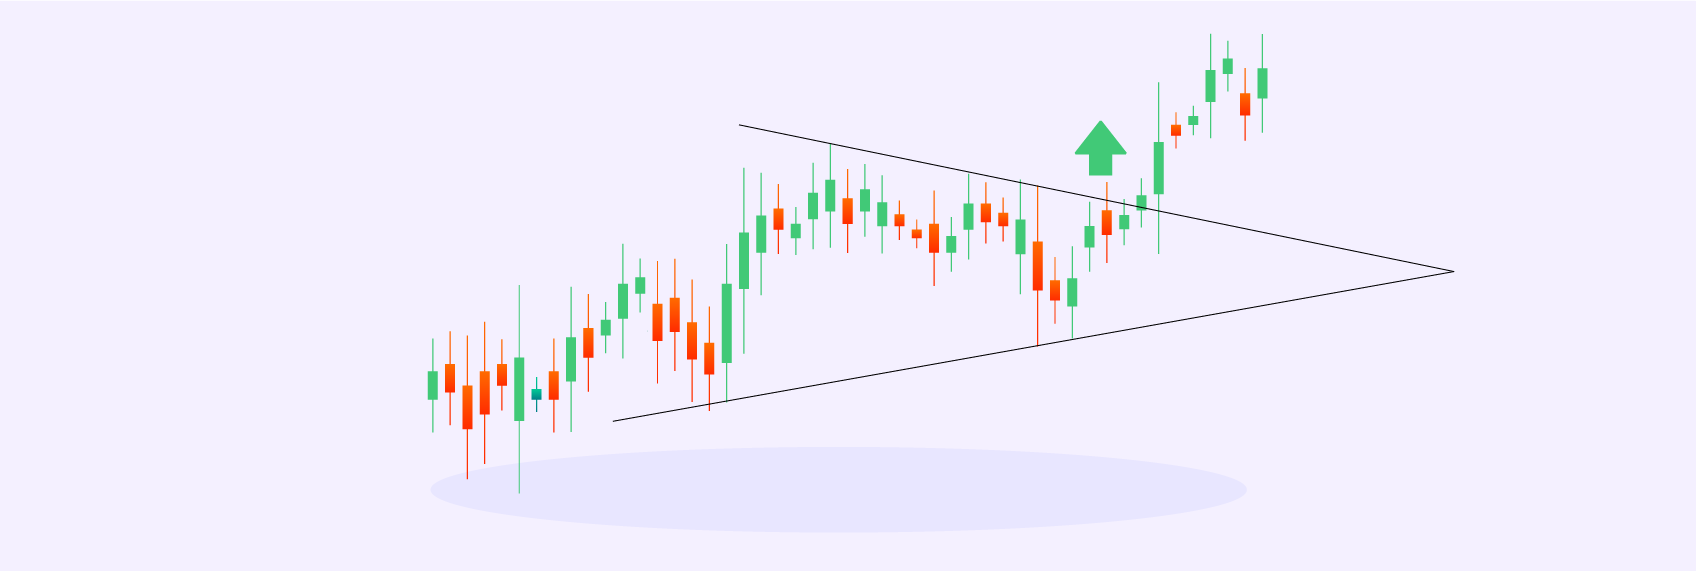
Imagine two converging trend lines, one sloping upwards and the other downwards, forming a triangular shape. This is the essence of a symmetrical triangle. The price action of the underlying asset gets compressed within these converging trend lines, creating a period of consolidation.
Key characteristics of a symmetrical triangle
- Equal Slopes: The two trend lines ideally have equal slopes but in opposite directions.
- Price Action: The price action alternates between bouncing off the upper and lower trend lines, demonstrating buyer and seller indecision.
- Contraction: As the pattern progresses, the price fluctuations become smaller, indicating tightening consolidation.
How to find the symmetrical triangle?
The key element of the symmetrical triangle is the breakout, which signifies a decisive move by either buyers or sellers. Here's how to interpret the breakout:
- Upward Breakout: If the price decisively breaks above the upper trend line, it typically indicates a bullish signal, suggesting a potential price increase. This could be a good time to consider buying call options.
- Downward Breakout: Conversely, if the price breaks below the lower trend line, it's often interpreted as a bearish signal, suggesting a potential price decrease. This might be a good time to consider buying put options.
Symmetrical triangle trading strategy
Once you identify a symmetrical triangle, here are some options trading strategies to consider:
- Breakout Trading: Enter a trade (call option for uptrend breakout, put option for downtrend breakout) only after a confirmed breakout above or below the trend lines. Avoid anticipating the breakout, as false breakouts can occur.
- Target Price: Set your target price based on the height of the triangle. For breakouts, measure the distance between the apex (point of convergence of trend lines) and the base of the triangle. Add this distance to the breakout point for an upward breakout target or subtract it for a downward breakout target.
- Stop-Loss: Place a stop-loss order slightly below the breakout point for call options or above the breakout point for put options to limit potential losses in case of a false breakout.
Limitations of the symmetrical triangle
It's important to remember that no technical indicator is foolproof. Here are some limitations to consider:
- False Breakouts: Breakouts can be deceptive, and the price might reverse direction after a false breakout.
- Volume Confirmation: Strong trading volume on the breakout can increase the confidence in the signal.
- Overall Market Trend: Consider the prevailing market trend alongside the symmetrical triangle for a more comprehensive analysis.
Conclusion
The symmetrical triangle is a valuable tool for options traders, helping identify potential breakouts and make informed decisions. However, it should be used in conjunction with other technical indicators and fundamental analysis for a more robust trading strategy. By understanding its formation, interpretation, and limitations, you can leverage the power of the symmetrical triangle to enhance your options trading experience. Remember, consistent practice, risk management, and a healthy dose of scepticism are key ingredients for success in the options market.