
The precious metals complex has been in a sustained bull market since the Covid period. While both gold and silver have remained in a broader bullish zone, gold initially led the rally, supported by heightened macro uncertainty, geopolitical risks, and persistent central-bank demand.
For much of this phase, silver, despite positive momentum, lagged behind gold and underperformed on a relative basis.
That dynamic shifted decisively from April this year. Silver took over the leadership baton, staging a sharp catch-up rally after years of relative underperformance. Year-to-date, gold prices are up nearly 74 percent, while silver has delivered an eye-catching gain of approximately 139 percent, clearly outperforming gold over this phase of the cycle.
This transition from gold leadership to silver outperformance has materially altered the relative-value landscape within the precious metals complex and brings renewed relevance to the Gold–Silver Ratio.
What Is the Gold–Silver Ratio?
The Gold–Silver Ratio (GSR) is a widely followed relative value metric that measures how many ounces of silver are required to purchase one ounce of gold. Rather than signaling the absolute direction of prices, the ratio highlights the relative performance between the two metals.
A rising Gold–Silver Ratio indicates that gold is outperforming silver, or becoming more expensive relative to silver. Conversely, a falling ratio suggests silver is outperforming gold. As a result, the GSR is frequently used by investors to assess relative valuation and evaluate potential mean-reversion opportunities within the precious metals space.
Historical Context:
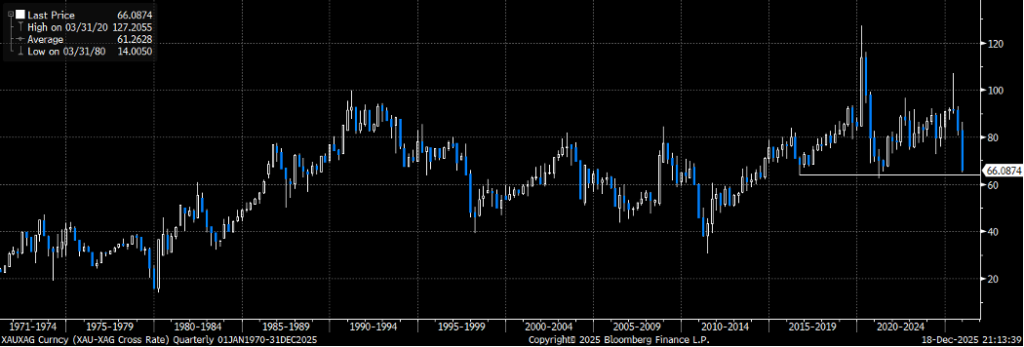
Earlier this year, the Gold–Silver Ratio climbed to near 105, its highest level since 2021. This extreme reading underscored a significant relative undervaluation in silver compared to gold.
Between the start of 2021 and 31 March 2025, gold prices rose by approximately 81 percent, while silver gained only about 47 percent. This prolonged divergence drove the ratio to elevated levels. However, from 1 April 2025 through 19 December, the trend reversed sharply. During this period, gold advanced roughly 47 percent, while silver surged nearly 110 percent, marking a decisive phase of catch-up.
This aggressive silver outperformance compressed the Gold–Silver Ratio substantially and shifted market focus from divergence to normalization.
Current Scenario: Ratio Back Near Long-Term Mean
At present, the Gold–Silver Ratio has retreated back toward its important long-term mean, hovering near the 64 to 65 zone. Historically, this region from 60 to 65 has acted as a broad equilibrium level during extended bull markets in precious metals.
With both gold and silver expected to remain within a broader bullish trend, the key question is how relative performance between the two metals may evolve from here.
This makes it an appropriate juncture to revisit the Gold–Silver Ratio, examine its historical behavior, and evaluate how different price movement scenarios in gold and silver could influence the ratio going forward
Going Forward:
With the Gold–Silver Ratio currently near its long-term mean, future direction will largely depend on relative performance rather than absolute price trends.
- Break below 65:
A sustained move below the 60–65 range would signal renewed silver outperformance. Historically, such phases have coincided with strong speculative and investment demand for silver. - Support and rebound from 65:
If the ratio stabilizes and rebounds from this zone, it would suggest gold regaining leadership within the precious metals rally. - Near-term risk:
While silver remains fundamentally bullish, technical indicators suggest it may be stretched in the short term, increasing the likelihood of consolidation or relative underperformance.
Scenario Analysis: How the Gold–Silver Ratio Responds to Price Changes
To better understand potential outcomes, we simulate various percentage changes in gold and silver prices and observe the resulting impact on the Gold–Silver Ratio. This approach does not attempt to forecast exact prices. Instead, it provides a framework to visualize how the ratio behaves under different relative performance scenarios.
The matrix below illustrates how the Gold–Silver Ratio would adjust if gold and silver were to move higher, lower, or remain flat by varying degrees. It highlights conditions under which gold outperforms silver, silver outperforms gold, or both metals move broadly in tandem.
| Silver | -20% | -15% | -10% | -5% | 0% | 5% | 10% | 15% | 20% | 30% |
| Gold | ||||||||||
| -20% | 64.38 | 60.59 | 57.23 | 54.22 | 51.51 | 49.05 | 46.82 | 44.79 | 42.92 | 39.62 |
| -15% | 68.41 | 64.38 | 60.80 | 57.60 | 54.72 | 52.12 | 49.75 | 47.59 | 45.60 | 42.10 |
| -10% | 72.43 | 68.17 | 64.38 | 60.99 | 57.94 | 55.18 | 52.68 | 50.39 | 48.29 | 44.57 |
| -5% | 76.45 | 71.96 | 67.96 | 64.38 | 61.16 | 58.25 | 55.60 | 53.18 | 50.97 | 47.05 |
| 0% | 80.48 | 75.74 | 71.53 | 67.77 | 64.38 | 61.32 | 58.53 | 55.98 | 53.65 | 49.52 |
| 5% | 84.50 | 79.53 | 75.11 | 71.16 | 67.60 | 64.38 | 61.45 | 58.78 | 56.33 | 52.00 |
| 10% | 88.52 | 83.32 | 78.69 | 74.55 | 70.82 | 67.45 | 64.38 | 61.58 | 59.02 | 54.48 |
| 15% | 92.55 | 87.10 | 82.27 | 77.94 | 74.04 | 70.51 | 67.31 | 64.38 | 61.70 | 56.95 |
| 20% | 96.57 | 90.89 | 85.84 | 81.32 | 77.26 | 73.58 | 70.23 | 67.18 | 64.38 | 59.43 |
| 30% | 104.62 | 98.47 | 93.00 | 88.10 | 83.70 | 79.71 | 76.09 | 72.78 | 69.75 | 64.38 |