The natural gas market has traveled a remarkable path over the past year — a story of extremes marked by a sharp downturn followed by a steady and confident recovery. In late 2024, Henry Hub prices hovered near historic lows as production surged and a mild winter curbed heating demand. Ample supply pushed storage inventories well above seasonal norms, keeping prices depressed around $2.12 per MMBtu, while on the MCX, natural gas futures touched a low of ₹158.60 in August 2024 — painfully low levels for producers.
By early 2025, however, the tide began to turn. Colder weather boosted heating demand just as U.S. liquefied natural gas (LNG) exports accelerated, channeling more American gas toward energy-hungry Europe and Asia. The combination of firmer demand and tightening storage balances ignited a sharp rebound. By January–February 2025, Henry Hub prices had climbed above $4.00 per MMBtu, while MCX prices surged to a high of ₹394.20, nearly doubling from the previous year’s lows.
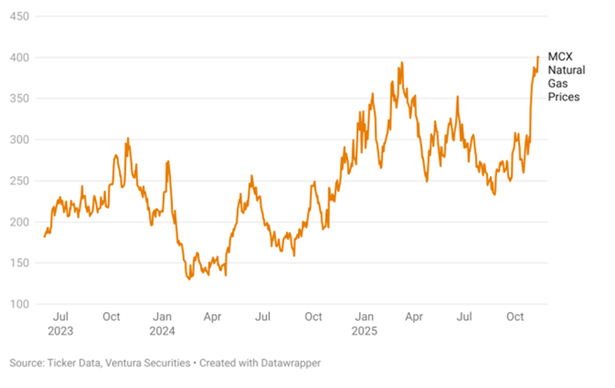
Although prices eased slightly through the spring and summer months, they remained comfortably above 2024 levels. By October 2025, Henry Hub averaged around $3.19 per MMBtu, reflecting a strong 50% year-on-year gain. In essence, the 2024–2025 period marked a true comeback for natural gas — transforming from a phase of oversupply and weakness to one of renewed balance and resilience.
What Drove Prices Higher
1. LNG Exports — America’s Gateway to the World
LNG has become one of the strongest pillars of U.S. natural gas demand. As new export terminals came online and global prices remained firm, American cargoes continued to flow steadily toward Europe and Asia, tightening domestic supply and supporting prices. The surge in exports was further fueled by Europe’s strategic push to reduce its dependence on Russian gas, prompting a sustained increase in U.S. LNG shipments. This expanding export footprint has not only bolstered demand but also firmly linked U.S. natural gas prices to global market dynamics.
2. U.S. Production — The Supply Engine
Production remained robust, led by shale plays and associated gas from oil wells. Even during the 2024 price slump, improved drilling efficiency and strong infrastructure helped maintain output levels.
3. Weather — Nature’s Wild Card
Weather remains the most unpredictable factor. A colder-than-expected winter in early 2025 spurred a sharp rise in heating demand, while a mild spring and summer prevented excessive price spikes.
4. Storage Levels — The Market’s Safety Net
At the start of 2025, U.S. storage was comfortably above the five-year average. However, as winter demand and LNG exports drew inventories lower, traders began to price in tighter balances — helping sustain higher prices through the year.
5. Global Competition — The LNG Connection
The U.S. market is now more globally linked than ever. When European or Asian spot prices rise, U.S. exports increase, reducing domestic supply and boosting Henry Hub prices. The reverse also holds true.
Natural Gas Inventory and Seasonal Trends
U.S. natural gas inventories follow a distinct seasonal rhythm. Stocks typically decline from November through March as colder temperatures boost heating demand across homes, businesses, and power generation. This steady draw down in storage tightens supply and supports prices.
As temperatures warm, the focus shifts to replenishment — April through October marks the injection phase, when utilities rebuild inventories ahead of the next heating season. Expectations of a colder or extended winter can intensify this cycle, as traders anticipate stronger consumption, faster inventory depletion, and upward pressure on prices.

Source Bloomberg
Price Levels
The outlook for natural gas in 2026 appears cautiously bullish, supported by firm seasonal demand and strong export momentum. Prices have already rallied by nearly ₹150 since mid-October, reflecting renewed buying interest. On the technical front, immediate resistance is seen near ₹440, and a sustained close above this level could open the door for a further move toward ₹490–₹500. On the downside, immediate support lies near ₹350, and a break below this zone may trigger additional weakness toward the ₹310–₹300 range.