Traders are always looking for patterns, inefficiencies, and signals that could give them an edge in the complicated and quickly changing world of financial markets. The Fair Value Gap (FVG) is one idea that has been getting more and more attention from technical analysts and price action traders.
The fair value gap is not just a technical glitch; it also shows how institutional order flow, market psychology, and liquidity dynamics work. When market forces cause short-lived imbalances, they leave behind untested price ranges where there is little or no trading activity. As markets move toward equilibrium, these areas may attract future price action for traders.
The study of fair value gaps has gained significant importance in recent years, especially in the Indian stock market, where these formations commonly occur in both NSE and BSE securities. The idea goes beyond just looking at gaps to give us information about how the market works, what institutions do, and what brings prices back to normal.
This guide talks about what a fair value gap is, how it forms, how to find it, and how to use it in trading strategies. It will also look at how it fits into bigger investment frameworks and how to analyze intrinsic value. By the end, you will know exactly what FVG is in trading, how to use it, and where it might fit into a disciplined investment strategy.
What is a fair value gap?
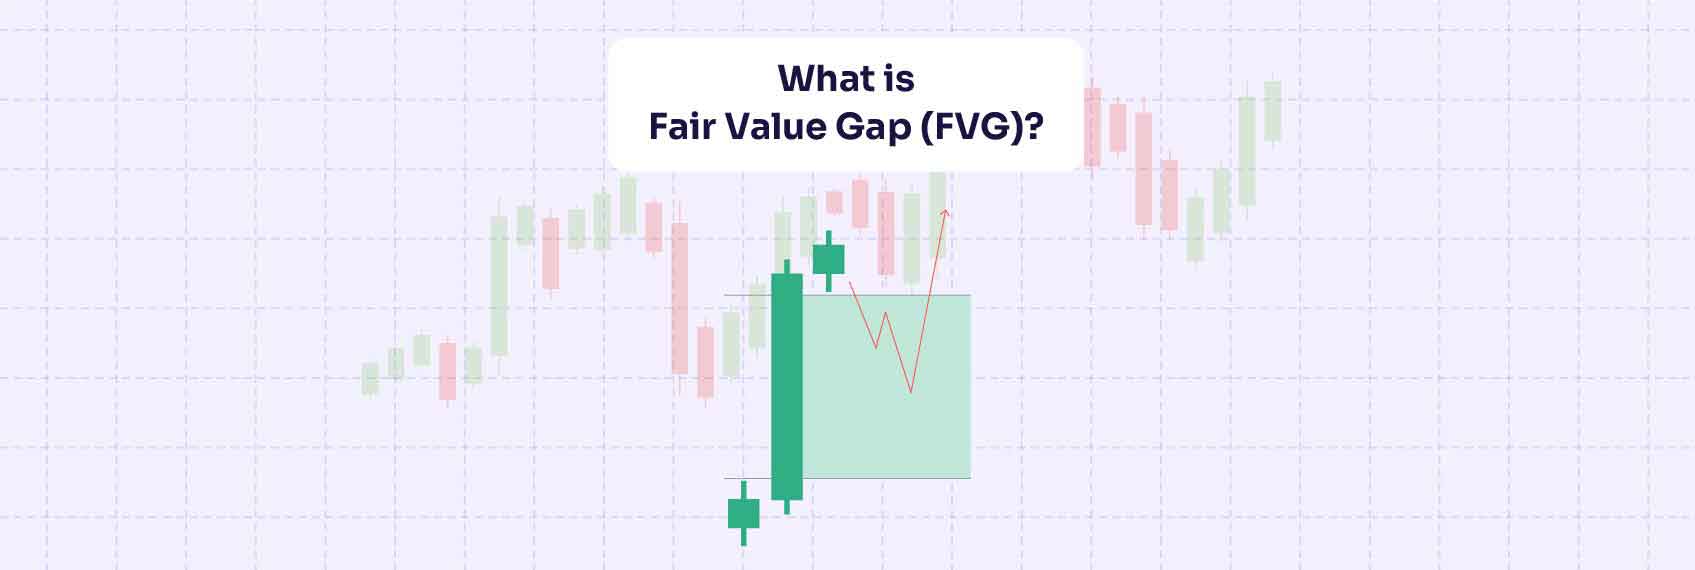
A fair value gap in trading is a part of the price chart where buyers and sellers were so out of balance that the market skipped over levels that were in between. This happens a lot when the market is moving strongly in one direction, leaving behind areas of "unfinished business" where normal trading doesn't happen.
A three-candle formation is what technically defines a fair value gap:
- The first candle shows the price range for the first time.
- The second candle shows a strong move in one direction.
- There is a clear gap between the first and third candles because the third candle does not overlap with the first candle's range.
FVGs happen during regular market hours, not between trading sessions, which is different from regular session gaps. For example, if a stock goes up from ₹100 to ₹110 because of earnings, the quick movement could skip over some levels, leaving a gap between the tested and untested ranges that is fair value.
In theory, these gaps are areas that the market might go back to in order to get back to a state of balance. This is why a lot of traders think they are important when making plans for entries, exits, or risk management.
To be clear, FVG stands for Fair Value Gap in trading.
Why do fair value gaps form?
Fair value gaps emerge from specific circumstances that temporarily disrupt price discovery. The most common causes include:
Market volatility and sudden moves
Periods of heightened volatility can cause rapid price jumps. Earnings announcements, market openings, or economic releases often lead to gaps as liquidity at intermediate levels gets absorbed too quickly.
Institutional trading activity
Large orders placed by institutions such as mutual funds or FIIs often overwhelm existing liquidity, forcing prices to move sharply and leaving gaps behind. In the Indian context, block trades in large-cap stocks like Reliance Industries or HDFC Bank often generate visible FVGs.
News and economic data
Announcements such as Reserve Bank of India (RBI) policy changes, corporate results, or mergers often cause immediate market reactions. These events create information asymmetry, where faster participants act before the broader market, leaving behind untested zones.
Liquidity imbalances
Stocks with thinner trading volumes, particularly mid-cap or small-cap securities, are prone to FVGs since even moderate order sizes can create sharp movements.
Market psychology
Sudden shifts in sentiment—triggered by geopolitical developments, regulatory updates, or sector-specific news—can amplify price reactions, thereby increasing the likelihood of gap creation.
How to identify a fair value gap?
Proper identification is essential if FVGs are to be incorporated into trading strategies.
The three-candle pattern: Look for a sequence where the middle candle displays strong momentum, and there is no overlap between the first and third candles.
Bullish FVG: The high of the first candle does not overlap with the low of the third.
Bearish FVG: The low of the first candle does not overlap with the high of the third.
Professional traders often add layers of validation such as:
Volume analysis: Strong gaps are typically accompanied by above-average volume.
Timeframe considerations: Gaps on daily or weekly charts carry more weight than those on five-minute intervals.
Market context: A fair value gap aligning with broader support, resistance, or trend direction increases reliability.
Modern charting platforms even provide automated FVG indicators, though manual identification sharpens analytical skills.
How traders use fair value gaps
Fair value gaps offer practical applications for both short-term traders and long-term investors.
Entry strategies
Instead of entering immediately after a gap forms, traders often wait for price to retrace into the FVG zone—particularly around the 50 per cent level—before entering. This ensures better risk-reward alignment.
Risk management
Stop losses are frequently placed just outside the FVG boundary, while profit targets can be aligned with previous highs or lows.
Reversals and continuations
Price action at FVG zones helps traders distinguish between trend continuation and potential reversal.
Multi-timeframe use
Experienced traders combine daily or weekly FVGs for overall direction with intraday gaps for tactical entries.
Example of fair value gap in action
Consider a pharmaceutical company trading at ₹500. Following a breakthrough clinical trial announcement, the stock opens at ₹520 and quickly rallies to ₹545 in a single candle. The subsequent candle pushes slightly higher but leaves a visible bullish fair value gap between ₹522 and ₹544.
Over the following sessions, the stock retraces to ₹534, near the midpoint of the gap. Traders monitoring this zone enter long positions with stops at ₹520 and targets around ₹550. The risk-reward ratio becomes favourable, demonstrating how FVGs structure both entries and exits.
Role in investment decisions
Fair value gaps also have value for medium- and long-term investors.
Portfolio risk management: Monitoring gaps provides insights into potential retracements in existing holdings.
Timing entries and exits: Investors can wait for retracements into FVG zones for improved entry prices.
Sector investing: FVG analysis on indices like Banking or IT highlights institutional rotation.
Validation: Repeated FVG formations in a stock may confirm institutional interest, strengthening investment conviction.
Conclusion
Fair value gaps give us a clear picture of how the market works by showing us where price discovery has been messed up. Traders and investors can learn about institutional activity, market sentiment, and possible entry and exit points by learning what FVG is in trading and using it consistently.
The fair value gap is not a system on its own; it is an important part of a larger analytical framework. It gives you both clarity and structure when you make decisions when you combine it with intrinsic value assessments, broader technical analysis, and disciplined risk management.
For traders in Indian markets, whether they trade stocks, commodities, or currencies, fair value gaps are a chance to align with institutional flows, improve timing, and manage risk well. Like all methods, you need to be patient, consistent, and have a balanced approach that takes into account both technical signals and the underlying fundamentals.