Summary :
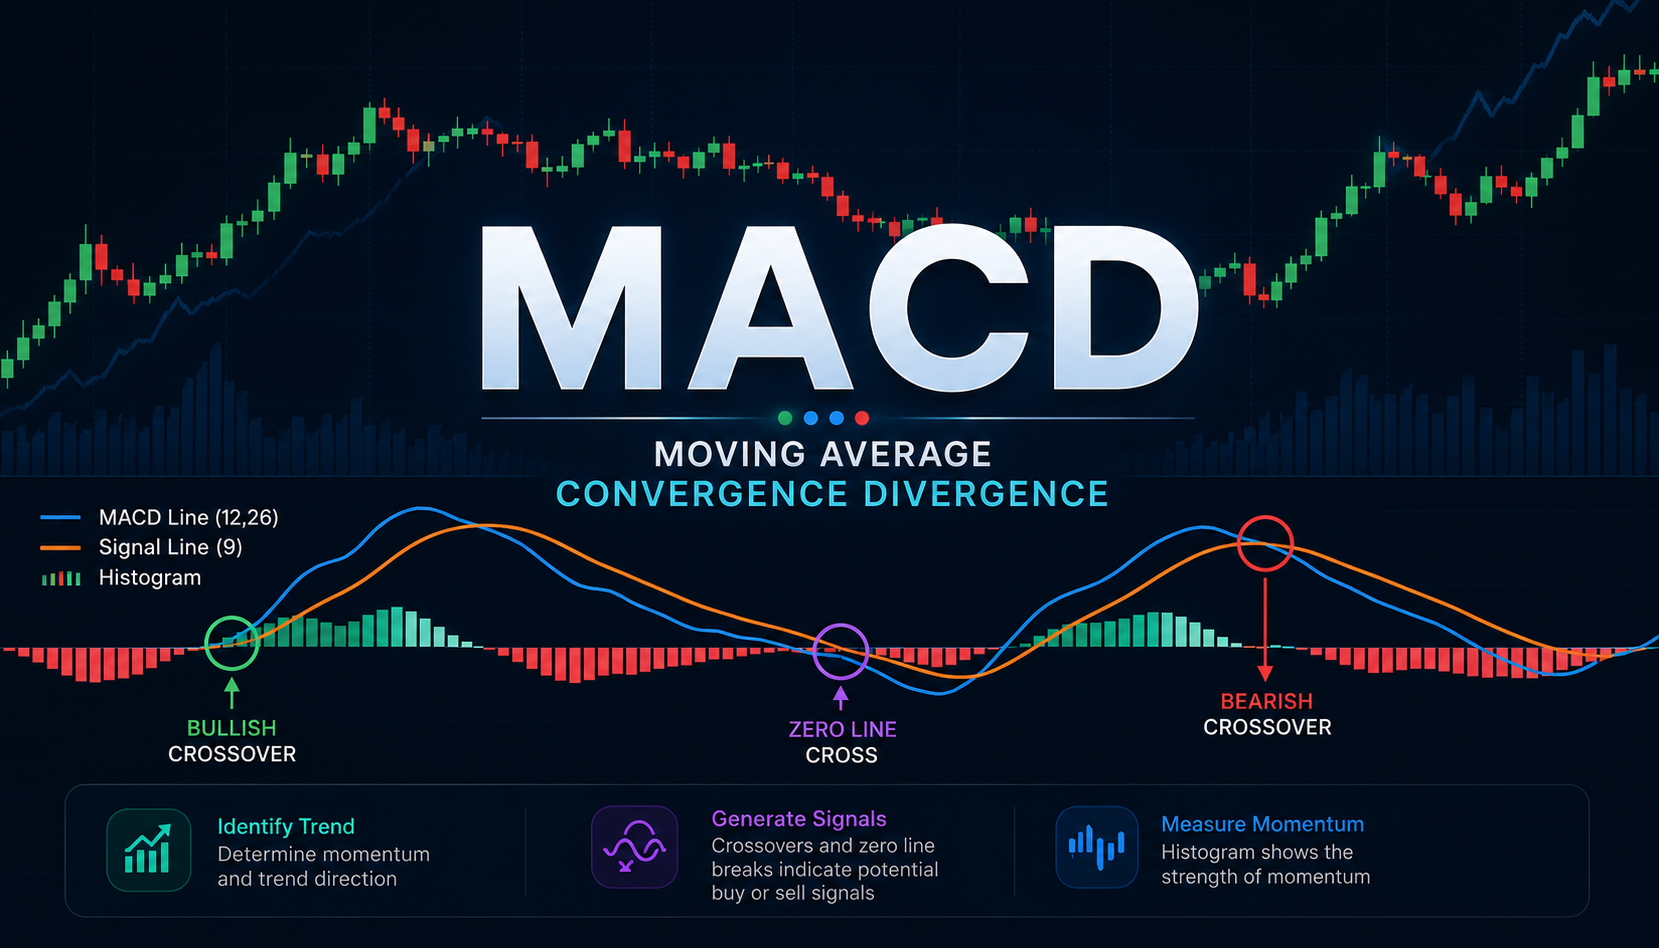
MACD (Moving Average Convergence Divergence) is a momentum-based trend-following indicator that helps traders identify changes in price direction and trend strength. It consists of three components: the MACD line, signal line and histogram, with the standard settings of 12, 26 and 9.
Traders use MACD to identify bullish and bearish crossovers, zero-line breaks and divergences between price and momentum. While the indicator works well for swing and positional trading in Indian markets, it is most effective when combined with other tools such as volume analysis, support and resistance levels, and ADX.
If you have spent even a few months trading on NSE or BSE, you have probably come across the MACD. It sits on almost every charting platform, from Zerodha's Kite to Upstox Pro, and yet many retail investors either misread it or use it in isolation. This guide breaks it down from the ground up, with a focus on how it actually behaves in Indian market conditions.
What exactly is MACD?
MACD stands for Moving Average Convergence Divergence. Developed by Gerald Appel in the late 1970s, it is a momentum-based trend-following indicator. The standard setting uses three numbers: 12, 26, and 9.
Here is how those numbers translate into the three components of MACD:
| Component | Setting | What It Tracks | Signal Type |
| MACD Line | 12 EMA - 26 EMA | Momentum direction | Primary |
| Signal Line | 9-day EMA of MACD | Smoothed momentum | Trigger |
| Histogram | MACD minus Signal | Momentum strength | Confirmation |
The MACD line is calculated by subtracting the 26-period Exponential Moving Average (EMA) from the 12-period EMA. When the faster EMA (12) is above the slower one (26), the MACD line is positive, indicating upward momentum. When it flips below zero, the trend has turned bearish.
Why MACD Matters in the Indian Context
Indian markets are deeply sentiment-driven. Events like Union Budget announcements, RBI Monetary Policy Committee (MPC) meetings, quarterly earnings from Nifty 50 companies, and even global cues from the US Fed can trigger sharp intraday moves. MACD, because it is based on EMAs rather than simple averages, responds to these moves faster than traditional indicators.
This makes MACD a useful filter for positional traders who hold stocks for 2 to 8 weeks, as well as for swing traders looking for 3 to 10 day moves in mid-cap and small-cap names.
Reading MACD Signals
There are four core signals Indian traders should know:
| Signal | What Happens | Action | Best For |
| Bullish Crossover | MACD crosses above Signal | Consider Buying | Swing / Positional |
| Bearish Crossover | MACD crosses below Signal | Consider Exiting | Short Sellers |
| Zero Line Cross | MACD moves above 0 | Trend Confirmation | Trend Traders |
| Divergence | Price vs MACD diverge | Reversal Watch | All Traders |
The bullish crossover, where the MACD line crosses above the signal line, is the most commonly used buy signal. But context matters. A crossover happening just below the zero line in a stock that has been in a three-month downtrend carries far less weight than one occurring after a consolidation phase near key support on the daily chart.
Divergence: The Signal Most Traders Miss
Divergence is arguably MACD's most powerful, and most overlooked, feature. It occurs when price and MACD are telling different stories.
Divergence signals work best on the daily and weekly timeframe. On a 5-minute chart, they produce too many false readings, especially during high-volume expiry sessions on every last Thursday of the month.
Three Mistakes Indian Retail Traders Make with MACD
1. Using MACD alone on intraday charts without volume confirmation. On a 15-minute chart of a stock like HDFC Bank, MACD signals can flip four to six times in a single session. Without volume backing, these are noise, not signals.
2. Treating every crossover as an entry point. In sideways or rangebound markets, which Nifty often enters post-election results or during festive season lulls, MACD produces frequent crossovers that lead nowhere. Pair it with ADX to filter trending conditions. An ADX reading above 25 confirms a trend is in place.
3. Ignoring the histogram. Most traders watch the lines and forget the histogram. But the histogram shrinking, even before the actual crossover, is often the earliest sign a momentum shift is coming. This gives you a few extra candles to prepare your entry.
Practical Setup for Indian Markets
For positional trades (2 to 6 weeks): Use the daily chart with default MACD settings of 12, 26, 9. Look for bullish crossovers confirmed by a close above the 50-day EMA.
For swing trades (3 to 10 days): Use the 1-hour or 4-hour chart. A MACD crossover here, confirmed by price breaking above a recent resistance level, is a decent entry framework.
For Nifty Bank and Nifty options: Focus on the 15-minute chart on the daily timeframe. MACD crossovers near 9:30 AM or after the European markets open at 1:30 PM IST tend to carry more volume and therefore more reliability.
Final Thought
MACD is not a magic indicator and no single tool is. But used with discipline and in the right market context, it has proven its value across decades of Indian market data. The traders who get the most out of it are those who understand what it measures, respect its limitations, and use it as one layer of a broader trading framework rather than a standalone buy-sell signal machine.
Start with the weekly chart of Nifty 50 and simply observe how MACD has behaved around major turning points over the last five years. That exercise alone will build more intuition than reading ten books on technical analysis.