Tweezer top and bottom candlestick patterns are widely known reversal signals in technical trade analysis in the Indian stock market. The Indian stock market is famous for its volatility, unpredictability and rapid price changes. For traders and analysts, this market activity requires accurate tools to gauge investor sentiment and pinpoint possible reversals before they occur. Among the various tools in technical analysis, the tweezer candlestick family—which includes both tweezer top and bottom—stands out as a key visual indicator of critical turning points.
The tweezer top candlestick pattern is a possible bearish reversal that occurs after a long uptrend, while the tweezer bottom candlestick pattern is a potential bullish reversal that may happen after a long downtrend. A bearish reversal occurs at the end of an uptrend. It represents the exhaustion of the buyers (Bulls), and a takeover by the sellers (Bears). A bullish reversal occurs at the end of a downtrend. It is a sign that the sellers have exhausted themselves, and the buyers have started finding the price attractive again and have increased their participation. The candlestick patterns are useful in helping the trader comprehend the support and resistance levels in the market that are crucial in trade entry and exit strategies.
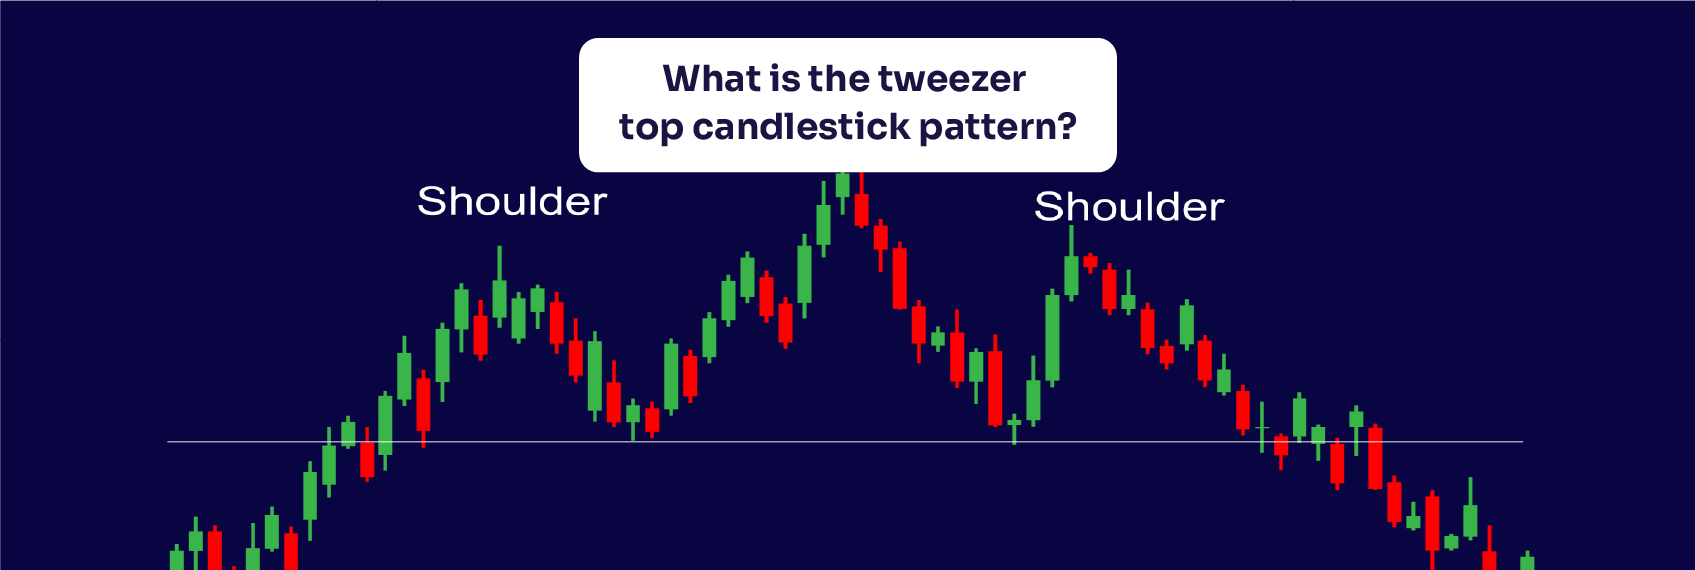
The tweezer top candlestick pattern is a type of candlestick pattern that occurs when two consecutive candlesticks, which are seen in an uptrend, have very similar highs. The first candle is generally bullish, showing strong buying force, while the second is bearish, showing that the sellers are attempting to drive the price lower. The two peaks of the candlesticks look like the legs of a pair of tweezers, and hence the name of the pattern: the tweezer top pattern.
There is a transition from bullish power to bearish influence that occurs in this candlestick pattern. The buyers who have been trying to push the price up are not able to overcome a resistance level, and this makes it possible for the sellers to take control of the trend. This is a warning signal that a bearish reversal is about to occur.
Here are the defining characteristics of a tweezer top pattern:
Understanding the psychology behind the tweezer top pattern can clarify its significance. It develops through a series of market events showing the struggle between buyers and sellers.
It is essential to remember that no candlestick pattern is self-reliant. Therefore, it is necessary that the tweezer top pattern is also confirmed by other technical tools and market trends. If properly used, it can be a very effective tool that can help in increasing the accuracy of trading.

First FY26 Annual Results: Companies Reporting Their Full-Year Numbers in April 2026
3 min Read Apr 7, 2026
What Traders and Investors Should Expect in FY 2026-27: Market Outlook, Risks, and Strategy
3 min Read Apr 6, 2026
How to choose the best mining stocks to buy in India in 2026
3 min Read Mar 30, 2026
Year end and the Tax Harvesting Ritual
3 min Read Mar 27, 2026
Market Volatility and Multi Asset Funds
3 min Read Mar 27, 2026
For android only