Technical analysis is a cornerstone of many trading strategies, and understanding chart patterns is a fundamental skill for any aspiring trader. Amongst these patterns, the head and shoulders (H&S) pattern stands out for its simplicity and potential effectiveness in identifying potential trend reversals. This blog delves into the anatomy of the H&S pattern, explores its variations, and analyses its trading implications.
How is the head and shoulders chart pattern?
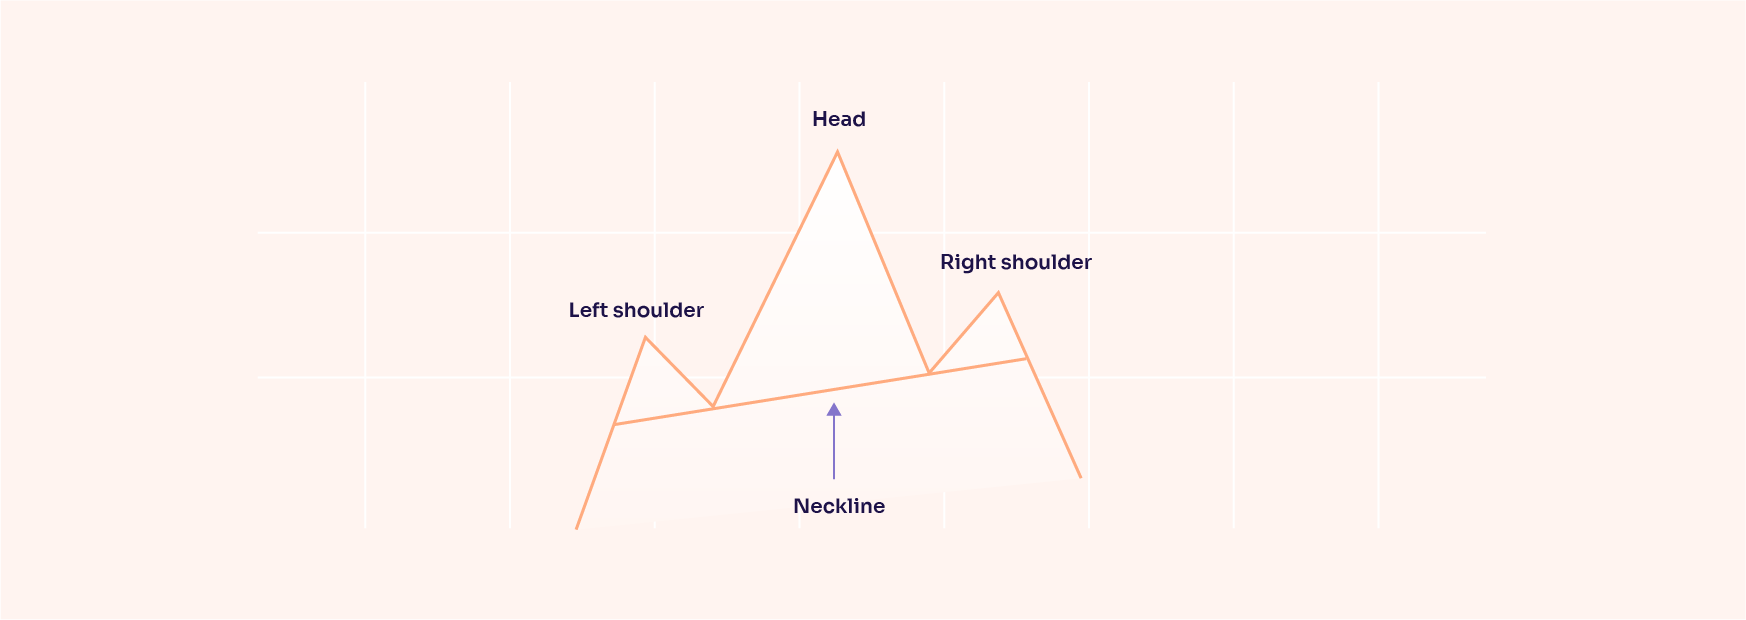
The H&S pattern resembles a human silhouette – a central peak (the head) flanked by two smaller peaks on either side (the shoulders). Here's a breakdown of its key features:
- Left Shoulder: The first price peak on the left side of the pattern.
- Head: The highest peak in the pattern, typically exceeding the height of both shoulders.
- Right Shoulder: The second price peak on the right side, usually lower than the head.
- Neckline: A horizontal line drawn connecting the swing lows (valleys) beneath the left and right shoulders. A break below this neckline signifies a potential trend reversal.
Variations of the head and shoulders pattern
While the classic H&S pattern is the most common, variations exist:
- Inverted Head and Shoulders: This pattern is flipped upside down, with a central valley (the head) and two smaller valleys on either side (the shoulders). It suggests a potential trend reversal from bearish to bullish.
- Double Top/Bottom: While not strictly an H&S pattern, it shares some similarities. Two consecutive peaks (double top) or troughs (double bottom) at roughly the same price level can signal a trend reversal, especially with a break above resistance (double top) or below support (double bottom).
Trading with the head and shoulders pattern
- Identifying the Pattern: Accurately recognising the H&S pattern formation on a chart is crucial. Look for the characteristic peaks and valleys, ensuring the neckline forms a clear horizontal support level.
- Confirmation is Key: A break below the neckline is considered the confirmation signal for a bearish H&S pattern. Similarly, a break above the neckline in an inverted H&S pattern suggests a potential bullish reversal. Never rely solely on the pattern; look for confirmation from other technical indicators like volume or moving averages.
- Entry and Exit Points: Once confirmation is received (breakthrough of the neckline), potential entry points can be strategically identified. Some traders might enter short positions (selling) after the neckline break in a bearish H&S pattern, while others might use stop-loss orders to manage risk. Exit points can be determined by profit targets or technical indicators.
Limitations of the head and shoulders pattern
- False Signals: The H&S pattern isn't foolproof and can sometimes generate false signals, especially in volatile markets.
- Timeframe Dependence: The H&S pattern can appear on various timeframes (daily, weekly, etc.), but its effectiveness might vary depending on the chosen timeframe.
- Subjectivity: Interpreting chart patterns can involve some subjectivity, and different traders might have varying opinions on the validity of a particular H&S formation.
Conclusion
The head and shoulders pattern is a valuable tool for technical analysis in options trading, offering insights into potential trend reversals. However, it should be used in conjunction with other technical indicators and fundamental analysis for a more comprehensive trading approach. By understanding the H&S pattern's structure, variations, and limitations, traders can potentially improve their ability to identify trend changes and make more informed trading decisions. Remember, successful trading involves continuous learning, risk management, and a healthy dose of scepticism when interpreting chart patterns.