
Markets are expected to remain extremely volatile. You might hear this phrase quite often from stock market experts. If you want to make your fortunes in stock markets, it’s imperative for you to know what is stock market volatility is and why volatility is important for investors.
So, what is stock market volatility?
In plain English, stock market volatility is the rate at which stock prices fluctuate during a specified period. However, the implied meaning of volatility in stock market is slightly different.
In a much wider context, volatility in stock market often hints at turbulent times and explosive price actions. Thus, volatility creates panic among investors. Nonetheless, volatility can also give you great investment opportunities.
A market index or a stock will be called ‘volatile’ if it experiences price swings outside its normal range. For instance, a stock that witnessed an average monthly price swing of 5%-7% for the last 5 years suddenly recorded a 15% move last month. Stock market experts would describe this instance as a spike in volatility.
How the stock market volatility is measured
Standard Deviation (SD) is the most widely used statistical tool to measure historical volatility. From the stock market perspective, SD indicates how wide the price fluctuations are from the averages. It also tells you the range and frequency of outcomes, which can be plotted on a graph.
What does the normal distribution curve look like?
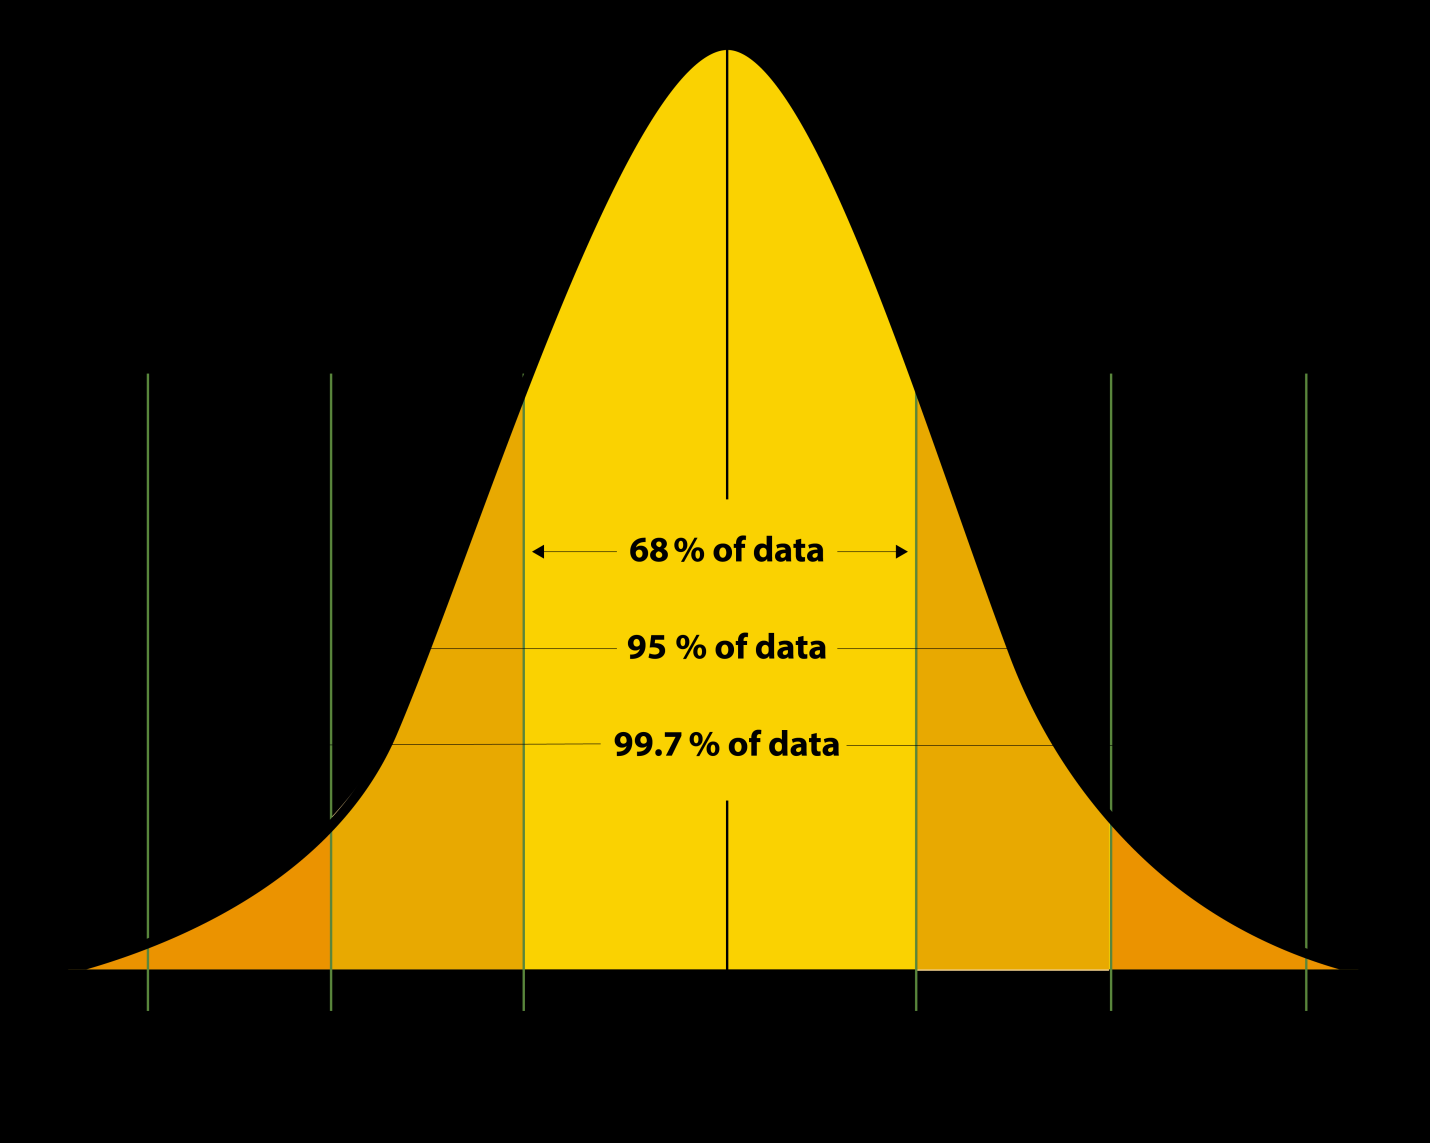
On a normal distribution curve, as shown below, the horizontal axis denotes observations and the vertical axis represents their frequencies. In a symmetrically distributed curve, which is called a normal curve, the majority of observations will revolve around the average, thus showing the highest frequency. The far left represents negative deviations, while the far right denotes positive deviations (with respect to the average).
(Source: nlm.nih.gov)
Whether a deviation is bad or risky depends on the quantum of the difference from the average value and its frequency. For instance, frequent stock price fluctuations within one standard deviation are considered normal. Overall, 95% of the time, the deviation in value is within the two standard deviations and 99.7% of observations fall within the three standard deviation range.
It’s noteworthy that 99.7% isn’t 100%. In other words, rare events pushing prices beyond three standard deviations denote abnormality and should be treated as red flag warnings that call for immediate attention. The 'tail' of the curve is indeed dangerous!
If you found the above commentary on the normal distribution curve all Greek and Latin, worry not! Here’s what you need to remember as an investor: In rare events, when prices significantly rise or fall over a short span of time, thereby deviating massively from their normal returns for a given period, you need to be extremely careful. A 10% fall in a day on the Nifty 50 would entail a high risk. Similarly, a 40% rise in a small-cap stock over 1-week shall also be treated as a risk.
Note: Using the SD, we can calculate the historical volatility of a stock or an index. Most investors would be better off knowing only about this form of volatility. However, if you are a trader or willing to venture into F&O (Futures and Options) trading, you may also want to know what the implied volatility is.
Anticipated volatility
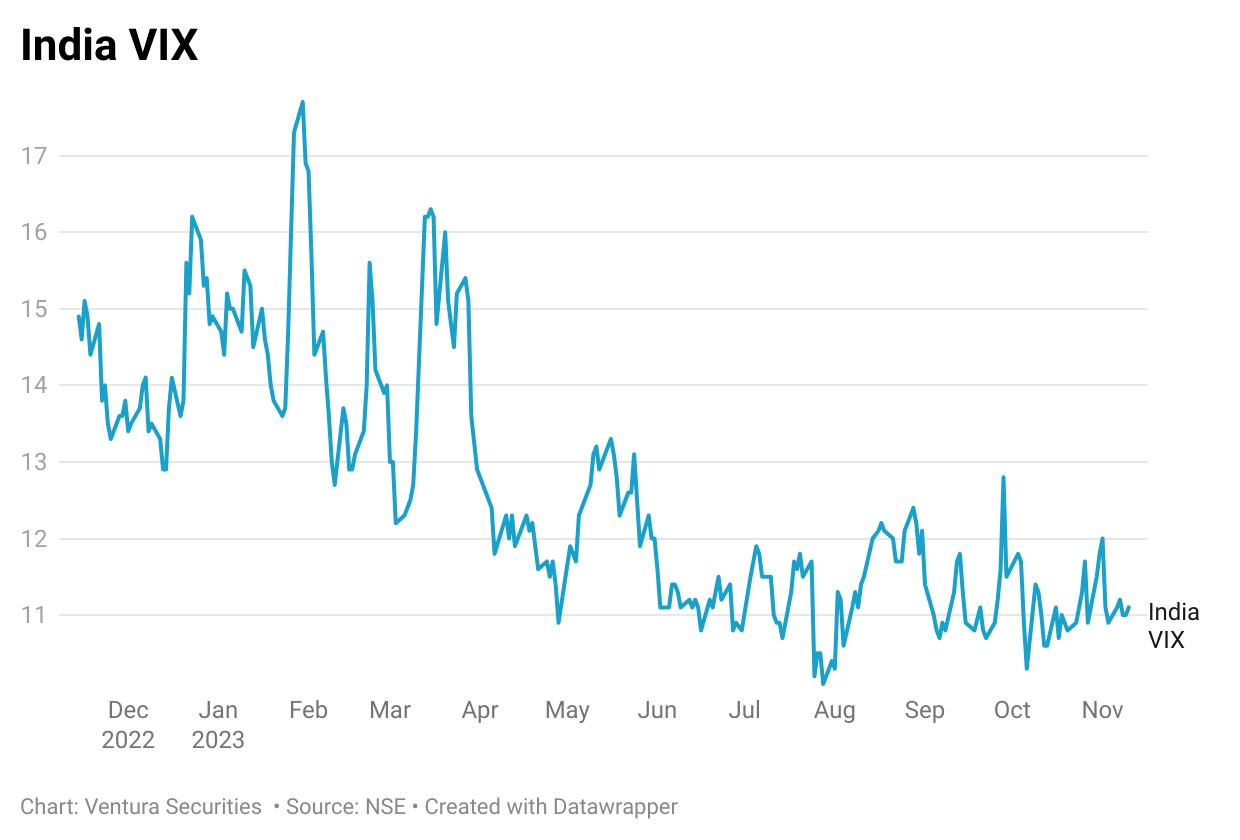
India VIX is an indicator of the market’s anticipated volatility in the near term—30 calendar days, to be precise. It is computed by taking into account the best bid-ask spreads on Nifty 50 Index options for the out-of-the-money calls. The simple interpretation of the India VIX index is that the higher the value, the higher the anticipated volatility. A reading near or above 20 suggests that markets are expected to remain choppy and uncertain in the times to come.
Market volatility vs volatility of an individual stock
So far, we have seen what is stock market volatility, how it is measured and why stock market volatility is important for investors. But unless we discuss the concept of Beta (β), the topic of volatility can’t be concluded.
If the SD tells you how much stock prices deviate from the mean value, the Beta reading indicates the volatility of a stock with respect to that of an index—thus denotes a systematic risk.
Although the future is always uncertain, a stock with a Beta of more than 1—a high Beta stock—would usually fetch excess gains/losses as compared to the index. On the other hand, a low-Beta stock—i.e. a stock with a Beta of less than 1—would fetch lower excess gains/losses as compared to the index. Assets with a negative co-relation move in the opposite direction and thus give you diversification opportunities.
In summary
The meaning of volatility in the stock market is highly contextual but, in general, denotes swings in returns—absolute as well as relative. Standard Deviation of a stock and its Beta value—current readings as well as historical readings—can give you useful inputs to gauge the risk involved in investing in that stock. Additionally, you may track the movement of the India VIX since it offers how volatile the frontline Index, Nifty 50, is expected to be over the short term.
How to manage the risk arising from high volatility
- Invest for the long-term
- Keep your goals in mind
- Diversify, diversify and diversify
- Don’t indulge in leveraged trading
Disclaimer:
The blog is for information purposes only and anything mentioned herein shouldn’t be construed as a fundamental reason to buy/hold/sell any stock. Furthermore, the information provided in the blog and observations made therefrom shouldn’t be treated as the extension of recommendations made on the other properties of Ventura Securities. If you follow any research recommendations made by our fundamental or technical experts, you should also read associated risk factors and disclaimers.
We strongly suggest you consult your financial advisor before taking any decision pertaining to your finances. Asset allocation becomes extremely relevant.
We, Ventura Securities Ltd, (SEBI Registration Number INH000001634) its Analysts & Associates with regard to the blog article hereby solemnly declare & disclose that:
We do not have any financial interest of any nature in the company. We do not individually or collectively hold 1% or more of the securities of the company. We do not have any other material conflict of interest in the company. We do not act as a market maker in the securities of the company. We do not have any directorships or other material relationships with the company.
We do not have any personal interests in the securities of the company. We do not have any past significant relationships with the company such as Investment Banking or other advisory assignments or intermediary relationships. We are not responsible for the risk associated with the investment/disinvestment decision made on the basis of this blog article.


Post your comment
You must be logged in to post a comment.