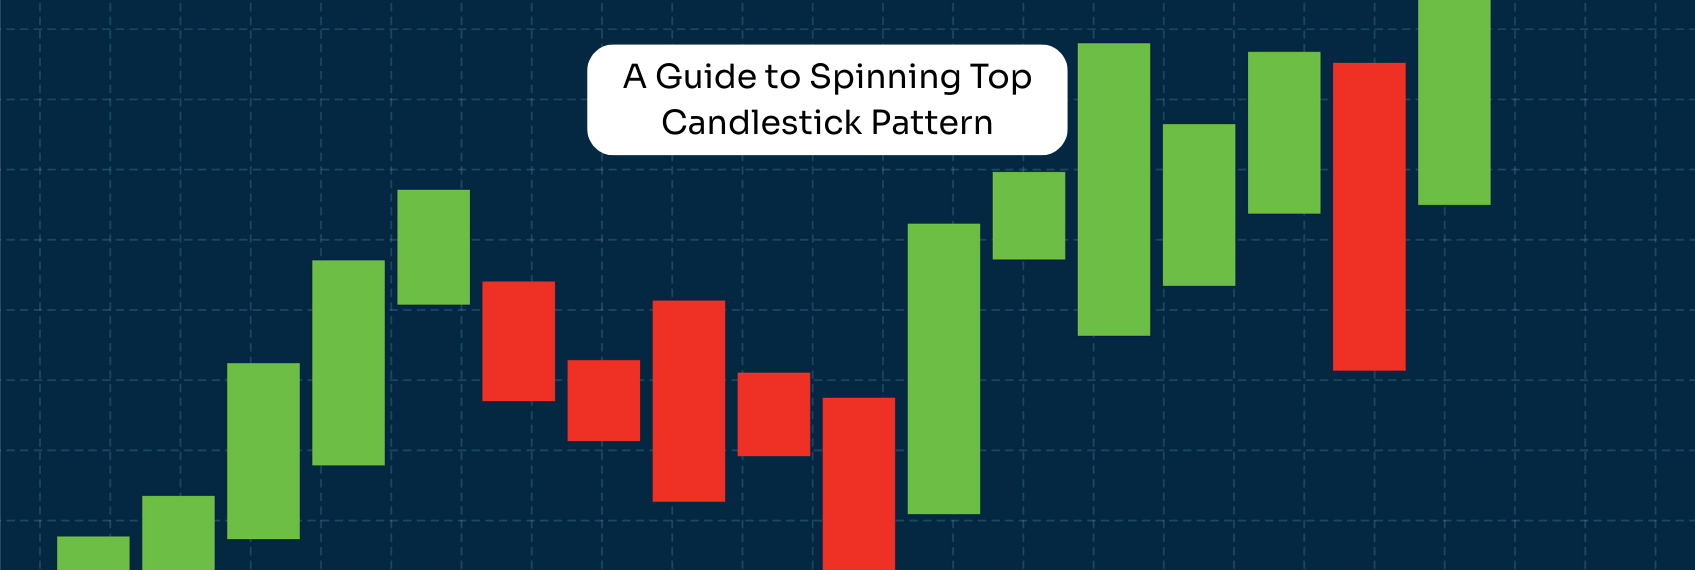
In the world of candlestick charts, some patterns speak loudly, while others whisper their message. The spinning top candlestick pattern is one such subtle signal. It may not scream “buy” or “sell,” but it quietly tells us that the market is uncertain about its next move. Recognising and interpreting this pattern can help traders anticipate possible shifts in market direction.
A spinning top candle is a candlestick with a small real body positioned in the middle of two long shadows. The upper and lower wicks are almost equal in length, showing that prices moved significantly in both directions during the time frame, but the opening and closing prices ended up close to each other.
This means neither buyers nor sellers had a decisive advantage. Both tried to push the market in their favour, but by the end of the session, neither side truly won. The result is a candle that reflects indecision.
When a spinning top forms, it signals a pause in the market’s momentum. This pause can happen in the middle of an existing trend or at turning points. If it appears after a strong uptrend, it might suggest that buyers are losing control and a reversal could follow. If it forms after a downtrend, it might indicate that sellers are running out of strength and buyers could step in.
The meaning becomes clearer when the candle that follows confirms the direction. Without that confirmation, it remains a sign of uncertainty rather than a definitive signal.
A bullish spinning top appears after a downtrend and hints that buying interest is returning. If the next candle moves upward, it can confirm the shift in sentiment.
A bearish spinning top shows up after an uptrend and suggests that buyers may be losing their grip. If the next candle closes lower, the pattern’s bearish indication gains strength.
It is important to note that on their own, spinning tops are neutral. Their bullish or bearish nature depends entirely on their position within a trend and the confirmation that follows.
The spinning top is valuable because it highlights market hesitation. Even though it does not provide exact price targets or guarantee a reversal, it helps traders identify moments when the market’s balance between buyers and sellers is delicate.
When used with other technical tools such as support and resistance levels or momentum indicators, the spinning top can be a helpful piece of the larger analysis puzzle.
The first step is always to confirm the signal. A spinning top alone is not enough to make a trading decision. Traders often wait for the next candle to indicate direction and may also use indicators like the stochastic oscillator or relative strength index to strengthen their analysis.
If a spinning top forms at the bottom of a downtrend and the next candle rises, traders may consider going long. If it appears at the top of an uptrend and the next candle falls, traders may look for shorting opportunities.
Some traders use derivatives such as contracts for difference to act on these signals without owning the actual asset. This flexibility allows them to trade in both rising and falling markets.
One advantage is that it works across different time frames, making it suitable for both short-term and long-term strategies. It can also act as a pause signal in an ongoing trend, allowing traders to prepare for possible entries or exits. When it appears after a strong move, it can alert traders that momentum may be fading.
Spinning tops are common, which means many of them will not lead to significant market moves. Even when confirmed, the resulting price movement may not always be large enough to justify a trade. The pattern also does not provide a clear profit target or stop-loss level, so traders need to combine it with other tools for risk management.
The spinning top candlestick pattern is a quiet but important signal of market indecision. While it does not provide a clear answer on its own, its presence invites closer attention, especially when it appears after strong price moves. Combined with confirmation from the following candle and other analysis methods, it can become a useful guide for anticipating possible reversals or pauses in the market.
For traders who understand that every candle tells a story, the spinning top is a reminder that sometimes the market simply takes a breath before deciding which way to run.
Old vs New Tax Regime: ₹20 Lakh Income Can Save You Over ₹1 Lakh
6 min Read Mar 20, 2026
Year-end Stock-taking Ritual for Stock Investors
6 min Read Mar 19, 2026
Tax Saving Deadline March 31: Key Financial Tasks You Must Complete
6 min Read Mar 17, 2026
From Locker Gold to Digital Gold: Why Indian Investors Are Shifting to Gold ETFs and Digital Gold
6 min Read Mar 16, 2026
Impact of the West Asia War on Crude Oil Prices: An Indian Perspective
6 min Read Mar 13, 2026
For android only