The Indian stock market continues to be a vibrant ground for wealth creation, attracting both seasoned professionals and new participants. Within this dynamic environment, technical analysis has long been relied upon as a compass to interpret the ebb and flow of price action. Among the many techniques available, candlestick patterns occupy a place of special importance. Of these, the harami candlestick pattern stands out as a meaningful indicator of potential trend reversals, with its bullish harami and bearish harami variations offering distinct insights into shifting momentum.
At the same time, investment products such as Exchange Traded Funds (ETFs) and Fund of Funds (FOFs) have emerged as powerful tools for those seeking diversification and efficiency. This essay explores the meaning of harami candlestick patterns in detail, explains the functioning of ETFs and FOFs in the Indian context, and evaluates their roles in shaping a balanced investment strategy.
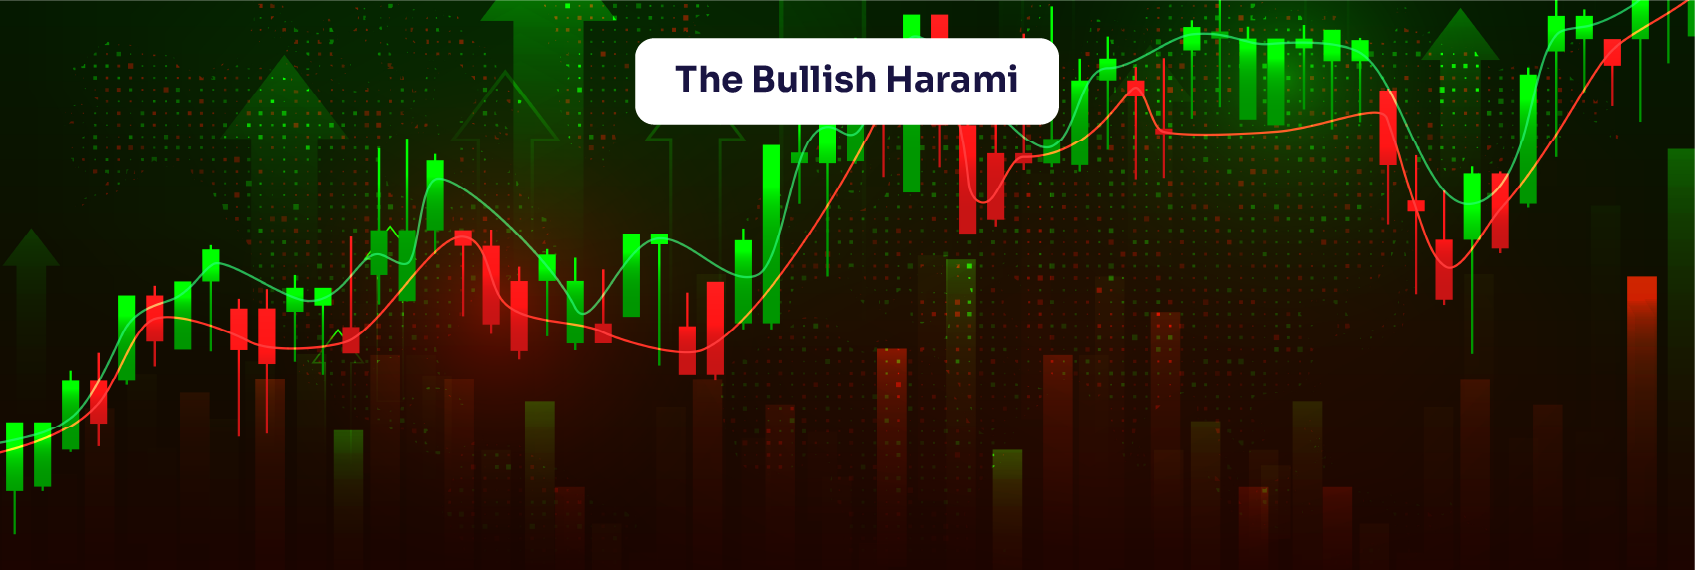
The harami candlestick pattern is a classic two-candle formation, frequently observed across stock charts. The term “harami” originates from Japanese and means “pregnant.” The name is visually descriptive: the larger candle represents the “mother,” while the smaller candle entirely contained within its body is the “child.” This nesting formation indicates indecision and the possible weakening of the prevailing trend.
Two prominent types of harami patterns exist:
It is important to view the harami candlestick pattern meaning as a signal of market hesitation rather than a guarantee of reversal. Confirmation is usually sought through additional indicators such as trading volume, support and resistance levels, or oscillators like the Relative Strength Index (RSI).
| | |
| Long red | Small |
| candle (mother)| green |
| | child |
This simplified sketch highlights the typical bullish harami, where a smaller green candle appears within the body of a preceding red candle.
An Exchange Traded Fund (ETF) is a market-linked investment vehicle that pools capital from investors to create a portfolio of assets. These assets may include equities, bonds, commodities, or indices. ETFs are traded on stock exchanges like shares, offering investors the twin advantages of diversification and liquidity.
| ETF Name | Underlying Asset | Category |
| Nifty BeEs | Nifty 50 index | Equity |
| SBI ETF Gold | Gold bullion | Commodity |
| SBI ETF 10-year Gilt | Government bonds | Bond |
| Nippon India Nifty ETF | Nifty index | Equity |
A Fund of Funds (FOF) is a mutual fund that does not directly invest in equities, bonds, or commodities but instead allocates its resources into other mutual funds or ETFs. The structure allows investors to achieve broad diversification with minimal effort.
Investor → FOF → Underlying Funds → Markets
The two vehicles differ in structure, taxation, costs, and liquidity.
| Feature | ETF | FOF |
| Structure | Listed on exchanges, direct holdings | Mutual fund investing in other funds/ETFs |
| Liquidity | High, with intraday trading | Lower, transactions only at NAV end-of-day |
| Management | Usually passive | Active or passive |
| Expense ratio | Lower, single layer of fees | Higher, double-layered |
| Taxation | Equity treatment for equity ETFs | Generally taxed like debt funds |
| Transparency | Daily disclosure | Depends on underlying schemes |
| Settlement | T+2 in dematerialised form | As per mutual fund norms |
There is no universal answer to this question. The choice between ETFs and FOFs depends on individual preferences, risk tolerance, tax planning, and time commitment.
Both ETFs and FOFs serve a legitimate purpose in India’s investment landscape. ETFs stand out for their agility, transparency, and cost-effectiveness, making them appealing to investors who are comfortable monitoring markets closely. FOFs, on the other hand, offer ease, diversification, and a guided approach, catering to those who prioritise simplicity over control.
The prudent investor should choose based on alignment with long-term goals, liquidity requirements, and tolerance for active decision-making.
Technical patterns such as the bullish harami candlestick pattern and the bearish harami candlestick pattern remain timeless tools for interpreting market sentiment. They remind investors that markets are constantly negotiating between fear and optimism. Alongside these indicators, modern investment vehicles such as ETFs and FOFs provide structured avenues to participate in equity, debt, and commodity markets.
A thoughtful combination of technical insight and prudent fund selection can help investors steer through India’s ever-changing financial terrain. By understanding the harami candlestick pattern meaning, recognising the strengths of ETFs, and appreciating the convenience of FOFs, investors are better placed to make informed, resilient decisions

Year-end Stock-taking Ritual for Stock Investors
4 min Read Mar 19, 2026
Tax Saving Deadline March 31: Key Financial Tasks You Must Complete
4 min Read Mar 17, 2026
From Locker Gold to Digital Gold: Why Indian Investors Are Shifting to Gold ETFs and Digital Gold
4 min Read Mar 16, 2026
Impact of the West Asia War on Crude Oil Prices: An Indian Perspective
4 min Read Mar 13, 2026
The Year-end V-Theory — Will it Play Out Again This Year?
4 min Read Mar 13, 2026
For android only