
If you aspire to be a Futures and Options (F&O) trader, then it is important to understand Open Interest (OI) thoroughly.
What is OI in options trading?
Open interest, or OI, as the name suggests, is the total number of unsettled options contracts for a given asset for a specific expiry.
Let’s take a closer look at OI.
In every trade, there is a buyer and a seller. Likewise, every option contract has a buyer and a writer. The buyer of a contract creates a long position, and the seller of a contract creates a short position. Together, they are counted as the open interest of 1.
Open Interest doesn’t tell you how many traders are participating. The OI in F&O trading only tells you how many contracts are still outstanding. If there are 100 longs and 100 shorts, then there must be 100 contracts, so the OI in this case is 100.
A rising OI indicates an increase in trading activity and vice versa. When the OI increases, more money enters the markets and vice versa. Professional options traders prefer the most active contracts for trading as they offer more liquidity.
How is OI different from volume?
Trading volume denotes the number of contracts traded, while OI denotes the number of open contracts, i.e., contracts that are active. Thus, volume is the number of transactions, while OI is the quantum of open contracts.
Using OI in options trading
OI can increase only when new contracts are added. OI decreases only when old contracts are squared off without new ones being added. An unusually high OI depicts a potential overheating of the market due to unusually high trading activity.
Change in OI is as important as OI itself. Because that tells you how and where the interest of traders is moving.
So, you must come up with the question: how do I interpret the option chain and OI interest?
Here we go! Let us look at Image 1.
As of March 22, 2024, Nifty 50 hovered at 22,085. Put writers, as denoted by the change in OI in Image 1, were most active at the strike of 22,100. On the other hand, call writers crowded in at the strike of 22,000 and 22,200. The monthly expiry is on March 28, 2024.
Image 1: How to use OI in options trading?
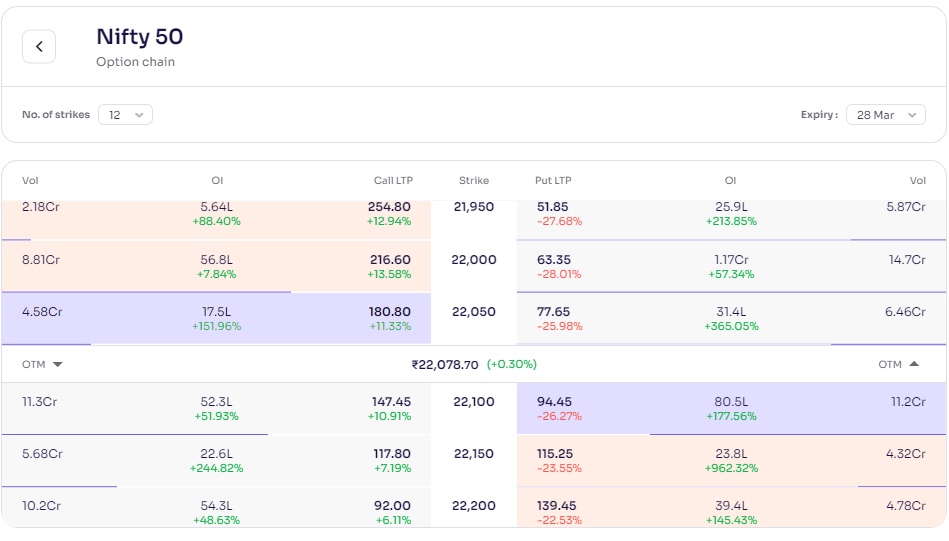
Under such a scenario, 22,100 would act as a resistance (since call writers are active here), and the prices are likely to find support at 22,000 as the put writers appear fairly confident here.
How do traders use OI in making trading decisions?
A positive change in OI build-up on the call side denotes the activity of call writers and such strikes usually act as resistance. Similarly, a change in OI build-up on the put side at a given strike usually suggests where the put writers are active. Such strikes usually act as support.
Check out the current prices. Under normal circumstances, strikes above and below the at-the-money contract for a given expiry will have the maximum OI. As an options trader, you should track the options chain on a continuous basis. It’s crucial to see how the OI interest moves once the prices break the crucial support and resistance levels.
Limitations of using open interest in options trading
OI data in isolation doesn’t give you any meaningful trading signals. However, when you combine OI and price data, you get a deeper understanding of a trade setup.
Conclusion
Since OI is the number of open contracts, it depicts where the money is moving, which makes it a crucial indicator for traders. Table 1 sums up how options traders should interpret and incorporate OI in their trading decisions.