The share market is full of patterns and indicators that help traders make informed decisions. One such key indicator is the Dragonfly Doji candlestick, which is widely used to understand market trends. But what exactly does it signify, and how can traders use it effectively?
Let’s learn more about the meaning of Dragonfly Doji, its importance in trading, and how to incorporate it into your strategies.
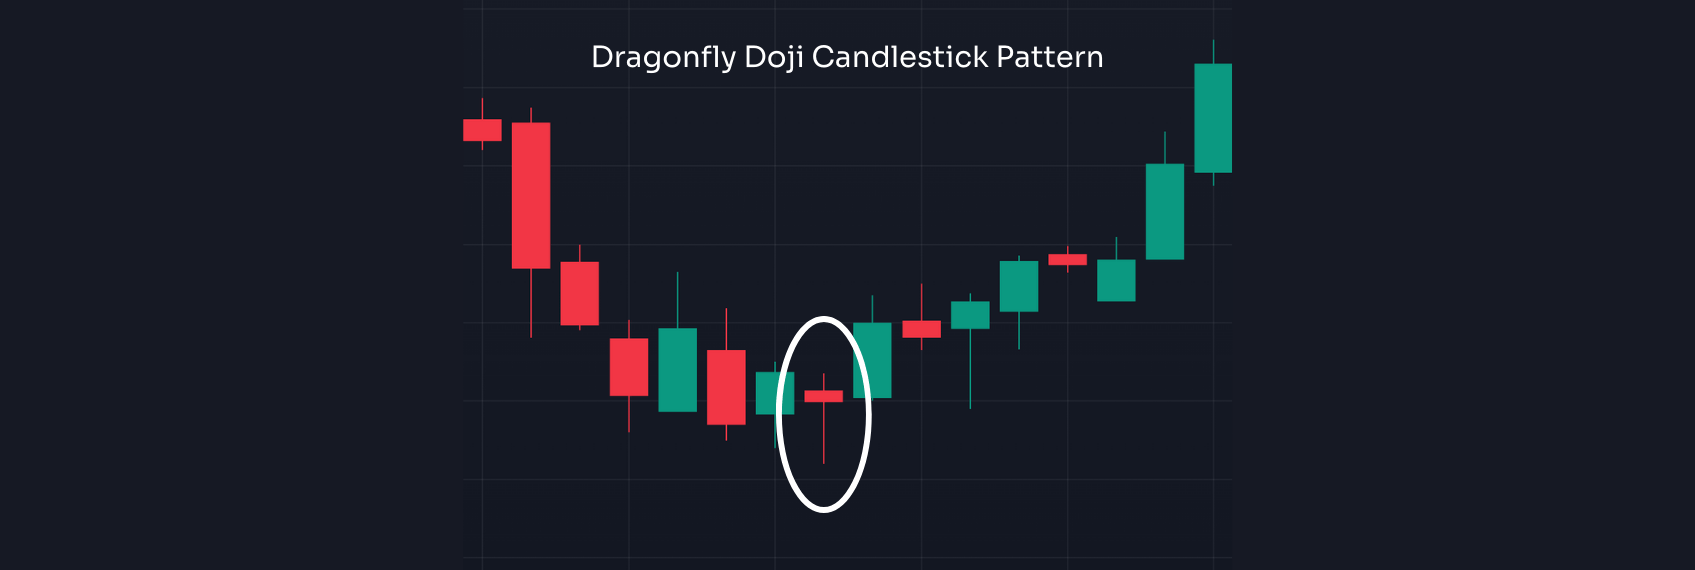
What is a Dragonfly Doji candlestick?
The Dragonfly Doji is a key candlestick pattern on trading charts, characterised by a long lower shadow, minimal or no upper shadow, and nearly identical open, close, and high prices. This pattern often signals a potential market trend reversal.
Meaning of Dragonfly Doji and its significance
The Dragonfly Doji candlestick pattern is often seen as a sign of market indecision. It forms when sellers push the price down during a trading session, but buyers regain control by the close. This shift can indicate a possible bullish reversal, which is especially noteworthy when it occurs at the bottom of a downtrend.
How to identify a Dragonfly Doji on trading charts
Identifying a Dragonfly Doji on trading charts involves careful observation of specific candlestick characteristics. This pattern offers valuable insights into potential market reversals, particularly in downtrends. Here's a more detailed breakdown:
- Long lower wick: This prominent feature signifies that sellers aggressively pushed the price down during the trading session, establishing a significant low. The length of the wick reflects the intensity of this selling pressure. This extended lower shadow demonstrates that although sellers were initially dominant, buyers ultimately stepped in.
- Minimal or no upper wick: The absence or near absence of an upper wick indicates that the highest price of the session was very close to the open and close. This suggests that buyers were able to counteract the selling pressure and drive the price back up to, or very near, the opening level, leaving little to no trace of upward price movement.
- Open, high, and close prices are nearly identical: The defining characteristic of a Dragonfly Doji is that the open, high, and close prices are clustered very closely together, or are the same. This implies a state of market indecision, where neither buyers nor sellers were able to maintain control throughout the session. The resulting small body, or lack thereof, signifies a balance of power, often preceding a potential trend reversal, especially if found at the bottom of a downtrend.
- Volume considerations: While not a direct part of the candlestick's visual structure, it is wise to consider the trading volume during the Dragonfly Doji's formation. A higher-than-average volume during this pattern can strengthen the signal, indicating a more significant shift in market sentiment.
- Location within a trend: The Dragonfly Doji is most significant when it appears at the bottom of a downtrend. In this context, it suggests that the downtrend may be losing momentum, indicating a potential bullish reversal is forthcoming. Conversely, its appearance in an uptrend is less reliable and requires careful confirmation.
Trading strategies using the Dragonfly Doji candlestick pattern
- Trading a bullish reversal
When a Dragonfly Doji forms at the bottom of a downtrend, it often signals that selling pressure is weakening. Traders can take this as a buying opportunity by confirming with other indicators, such as volume or moving averages.
- Entry point: After confirmation, the charts show upward momentum.
- Stop-loss: Just below the lowest point of the Dragonfly Doji.
- Profit target: Based on resistance levels or previous price highs.
- Trading a bearish continuation
If a Dragonfly Doji appears in the middle of a downtrend, it might not always indicate a reversal. Instead, it could suggest a temporary pause before further decline. Traders should watch for confirmation signals before making a decision.
- Combining with other indicators
The Dragonfly Doji candlestick pattern works best when used with other indicators. Some useful combinations include:
- Relative Strength Index (RSI): Helps confirm overbought or oversold conditions.
- Moving averages: Identify overall trend direction.
- Volume analysis: A Dragonfly Doji with high volume has a more substantial significance.
Also read: What is the long-legged Doji candlestick? A beginner’s guide for investors
Tips to avoid mistakes when trading with Dragonfly Doji
- Wait for confirmation signals: Always wait for a follow-up candle before entering a trade, as the Doji itself only indicates potential reversal, not guaranteed action.
- Use stop-losses: Protect your investment by setting a stop-loss. Even strong patterns can fail, and a stop-loss limits potential losses.
- Check other indicators/patterns: Combine the Dragonfly Doji with other technical indicators. This will give you a complete understanding of the market and improve your prediction accuracy.
The role of a trading website in analysing candlestick patterns
A trading website offers real-time market data and technical tools. These platforms allow traders to access various features that help in identifying and interpreting candlestick patterns effectively.
One of the key benefits of a trading website is the ability to view detailed candlestick charts. These charts provide traders with insights into historical price movements, enabling them to spot trends and make data-driven decisions. The availability of AI-powered tools further enhances analysis by identifying patterns like the Dragonfly Doji, helping traders recognise potential market reversals.