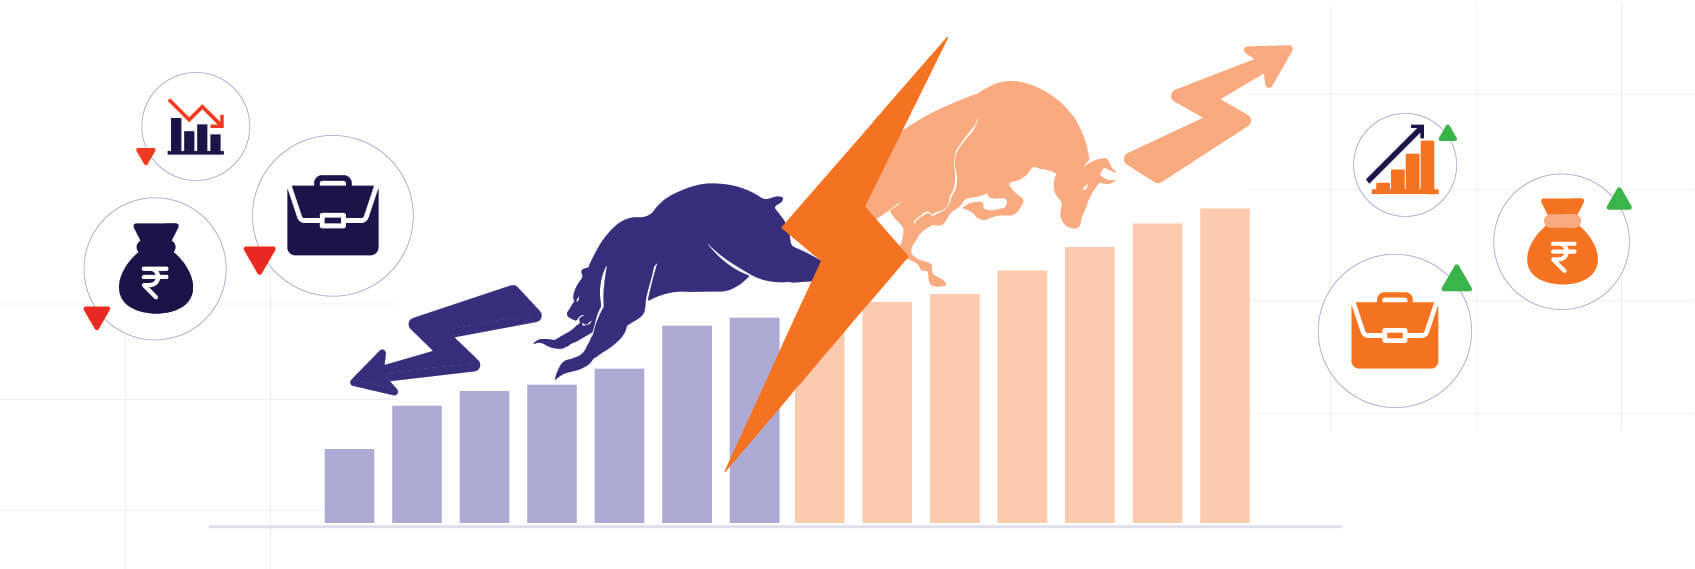
Markets go through both good and bad phases and they also have their own mood swings. If you invest in an asset class that is going through a good phase, you are likely to generate impressive returns.
On the other hand, if you enter markets when they are depressed, you are likely to face unfavourable conditions or outcomes, at least in the short term.
Therefore, it’s imperative for you to understand market phases before investing.
In this article we will address key questions pertaining to market phases.
What is bullish and bearish market phase?
How to identify a bullish Vs bearish phase?
What is the difference between bull and bear market?
What is a bullish phase?
A market phase in which the general price trend is upward and the investor sentiment is upbeat is known as the bullish phase.
What is a bearish phase?
A phase in which the general price trend is downward and the investor sentiment is depressed is known as the bullish phase.
Bullish Vs bearish market phases: how to identify them?
Normally, when the frontline indices rise 20% from their lows in a given timeframe, it’s said to be the start of a new bull market. Similarly, a fall of 20% from the top in a given timeframe indicates the start of a fresh bear run.
Bullish Vs bearish phase: thumb rule
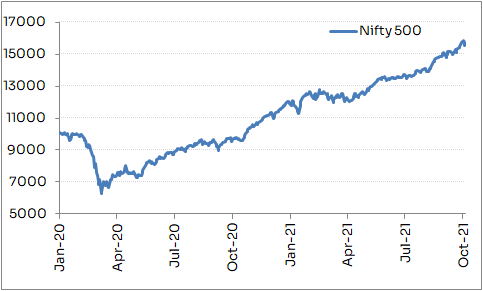
Data Source: NSE
Between 20th January 2020 and 12th March 2020, Nifty 500 index fell more than 20% and by 23rd March 2020, markets registered a 38% loss from their January 2020 levels.
However, markets recovered sharply thereafter and by 17th April 2020 they had recouped 20% from their March 2020 lows.
In effect, this means, Indian markets witnessed perhaps their shortest bear market in March 2020 and the new bull market started in the subsequent month.
Fundamental factors associated with bear markets
Bear markets are usually coupled with job losses, slowing economic growth, falling credit growth and industrial activities.
Fundamental factors associated with bull markets
Bull markets, on the other hand, are nurtured on quickened industrial and economic activities and a rise in employment opportunities.
Remember this crucial point about bull and bear markets
It’s noteworthy that since stock markets are leading indicators of an economy, stock market cycles usually precede economic cycles. Meaning, a bull market in stock market may actually start when the economy still goes through pain.
Remember, when markets started rising in the summer of 2020, many investors got confused by the market moves? The economic activity had virtually come to a halt due to lockdowns and markets appeared disconnected with this reality. Markets are forward looking always!
Similarly, at the start of a bear market, economic data can be so strong that many novice investors may brush off the possibility of a slowdown in disbelief. On 21st January 2008 Indian markets hit a lower circuit. This came at a time when everything looked hunky-dory in India. But as the global financial crisis unfolded later, cracks in the markets seemed justified—markets had fallen in anticipation of the crisis, which proved to be right in due course.
Does a bull or bear market affect all stocks similarly?
No. The timing of tops and bottoms in individual stocks may or may not concur with that of leading indices. A bull or a bear market in individual stocks can precede or follow the bull or bear market in leading indices.
How do I identify a bullish Vs. bearish trend using technical analysis?
Since economic cycles lag market cycles, identifying bull and bear markets just by looking at economic factors is slightly difficult.
Similarly, the thumb rule of 20% is easy to understand in hindsight but difficult to apply in real-time to identify the market trend. It’s difficult to make a distinction between a minor alteration of a trend and change in the trend to begin with.
And here, technical analysis may come in handy.
According to technical analysis, bullish vs. bearish sentiment can be identified by multiple indicators, of which the most basic and widely used one is crossover.
The golden crossover—50 Day Moving Average (DMA) surpassing 200 DMA—is considered the shift in sentiment—from bearish or sideways to bullish.
You may check the weekly and monthly charts by adjusting the timeframe. There too, if short term averages crossover long term averages, the long term trend might be bullish.
Ideally, short term averages should trade above long term averages and the stock should trade above both short term and long term averages. Moreover, 50DMA and 200DMA both should point upwards.
On the contrary, death-cross—50DMA crossing below 200DMA—indicates lull. And if you observe a similar pattern on weekly and monthly frequencies, then the long term trend is said to be bearish.
Short term averages should trade below long term averages and the stock should trade below both short term and long term averages. Moreover, 50DMA and 200DMA both should point downwards.
Understand Bullish Vs Bearish through technical analysis
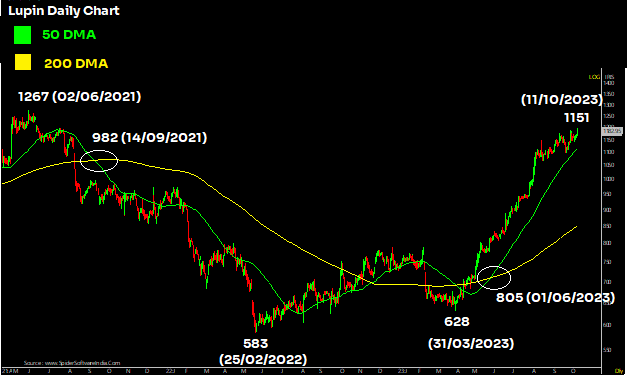
In the illustration above, the stock started its bearish move on 14th September 2021 when its 50DMA slipped below 200DMA, and 200DMA started pointing downwards, thereby forming a death cross. The stock crashed from Rs 982 in June 2021 to Rs 583 by February 2022.
It moved sideways thereafter for almost a year, despite 50DMA crossing over 200DMA since 200DMA was still heading downwards. The sentiment changed from bearish to bullish decisively on 1st June 2023, when the chart demonstrated a golden crossover with both averages pointing upwards and the stock closing well above these averages.
It’s noteworthy that crossovers shouldn’t be considered in isolation. Volume indicators and oscillators should be employed to confirm the trend.
Bull market vs bear market
| Basis of Comparison | Bull Market | Bear Market |
|---|---|---|
| Meaning in simple words | ‘Bullish’ = optimistic investors and rising markets | Bearish= pessimistic investors and falling markets |
| Potential outcomes for investors | The term ‘bullish’ indicates positive outcomes for investors who have bought the asset—stocks, bonds, commodities etc. | ‘Bearishness’ in the market suggests that outcomes for investors/traders who have bought the assets are unfavourable, in general |
| Sentiment | Strong | Weak |
| Associated fundamental factors | Rising output, high economic growth, healthy rate of job creation and moderate inflation among others | Falling output, subdued economic growth and high unemployment among others |
| Duration | Between several weeks to several years with corrective moves in between | Usually, bear market moves are sharp and last for a few weeks to months. Bear markets that last for more than a few years are difficult to escape |
Markets have their own ups and downs, which are also known as market phases. The ‘up’ phases are called bull phases, while the ‘down’ phases are called bear phases. Ironically, seeds of bull markets are sown during the troughs of bear markets, and overheated bull market tops open gates for bears.
Depending on your time horizon, risk appetite and asset allocation, bull markets and bear markets may affect your portfolio differently.


Post your comment
You must be logged in to post a comment.