Technical analysis is a cornerstone of active trading, and a diverse array of charting tools empowers traders to identify patterns and make informed decisions. The Kagi chart, with its unique approach, stands out as a valuable yet underutilised tool. This blog delves into the world of Kagi charts, exploring their construction, interpretation, and potential benefits for traders.
What is the Kagi chart in trading?
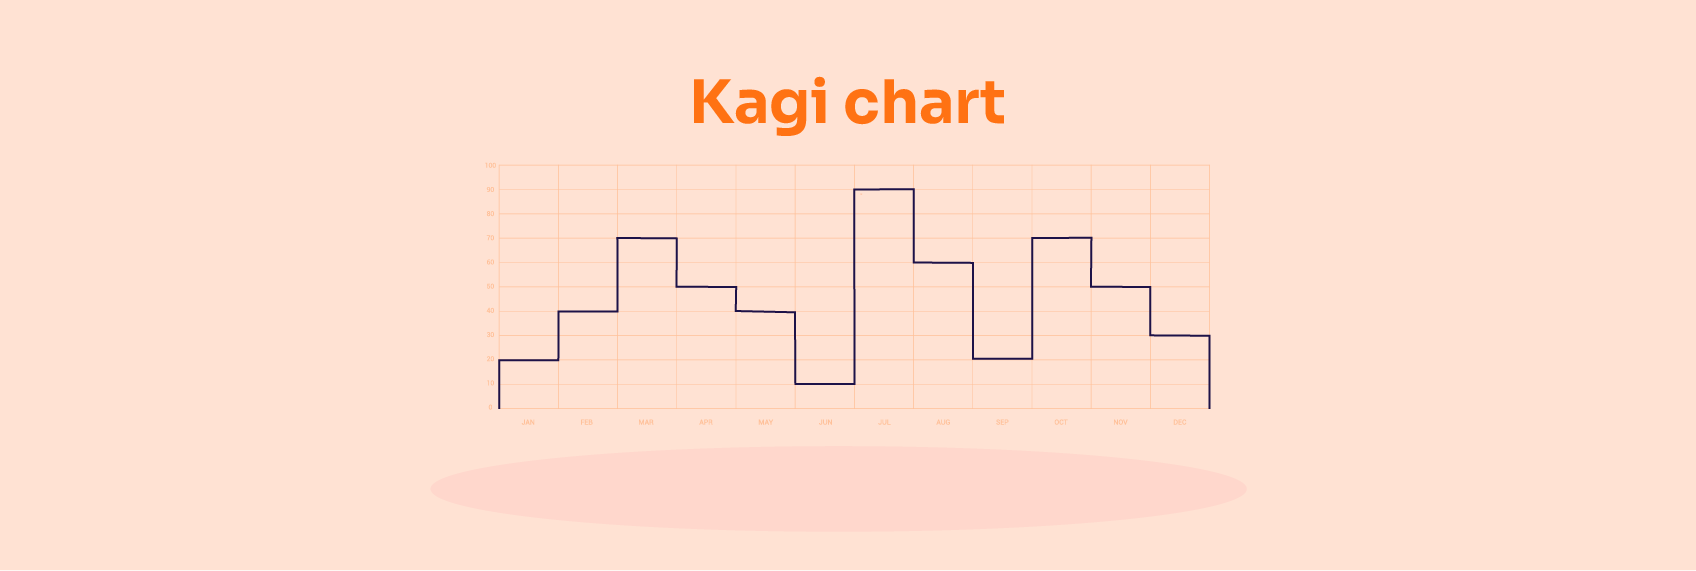
Unlike traditional bar or candlestick charts that depict price movements over time, Kagi charts (pronounced "kah-gee") focus solely on significant price changes. Developed in Japan in the 19th century, Kagi charts prioritise identifying trends by filtering out minor price fluctuations.
Kagi chart construction
- Vertical Lines: The Kagi chart uses vertical lines to represent price movements. An upward line signifies an upward price movement exceeding a predetermined threshold (known as the "up reversal amount"). Conversely, a downward line indicates a price decline exceeding a predetermined "down reversal amount."
- Horizontal Lines: Horizontal lines represent periods of price consolidation, where the price stays within the defined reversal amounts. The thickness of the horizontal line can sometimes represent the magnitude of price movement within the consolidation phase.
- Colours (Optional): Some Kagi charts use colours to differentiate between up and down trends. Typically, green lines represent uptrends, while red lines represent downtrends.
Interpreting the Kagi chart
Kagi charts offer valuable insights into market trends:
- Identifying Trend Changes: New vertical lines in the opposite direction signal potential trend reversals. A break above a previous high on the chart suggests a potential uptrend continuation, while a break below a previous low might indicate a downtrend.
- Gauging Trend Strength: The thickness of the vertical lines can provide clues about the strength of the trend. Thicker lines suggest stronger price movements in the direction of the trend.
- Filtering Market Noise: By focusing on significant price changes, Kagi charts help traders avoid getting misled by minor fluctuations, leading to a clearer picture of the underlying trend.
Trading strategies with Kagi charts
Traders can leverage Kagi charts for various strategies:
- Trend Following: Identify potential entry and exit points based on trend reversals signalled by new vertical lines in the opposite direction.
- Breakout Trading: Look for breakouts above resistance levels (in uptrends) or below support levels (in downtrends) for potential trading opportunities.
- Confirmation of Other Indicators: Use Kagi charts alongside other technical indicators to confirm trend direction and identify potential trading signals.
Kagi chart advantages
- Enhanced Trend Clarity: By filtering out minor price fluctuations, Kagi charts offer a clear picture of the underlying trend direction.
- Reduced Market Noise: Traders can avoid being swayed by short-term price movements that might not be indicative of the larger trend.
- Simplicity and Objectivity: The construction and interpretation of Kagi charts are relatively straightforward, minimising subjective bias.
Kagi chart limitations
- Limited Timeframe Information: Kagi charts don't explicitly show the time frame of price movements.
- Potential for Missed Opportunities: The focus on significant price changes might lead to missing out on short-term trading opportunities.
- Better Suited for Established Trends: Kagi charts might be less effective in identifying trend initiations compared to other technical indicators.
Conclusion
Kagi charts offer a unique perspective on market trends by filtering out noise and focusing on significant price movements in options trading. While they have limitations, their ability to provide a clear picture of trend direction and strength can be valuable for traders of various experience levels. Remember, Kagi charts are most effective when used in conjunction with other technical analysis tools and proper risk management practices. So, consider incorporating Kagi charts into your trading strategy and see if they can help you navigate the ever-changing market landscape.