Bollinger Bands are a widely used technical analysis indicator that helps traders gauge market volatility and identify potential options trading opportunities. Invented by John Bollinger, these bands consist of three lines: a simple moving average (SMA) in the centre, and an upper and lower band at a set number of standard deviations above and below the SMA. This blog equips you with the knowledge to effectively utilise Bollinger Bands in your trading strategies.
What are Bollinger Bands?
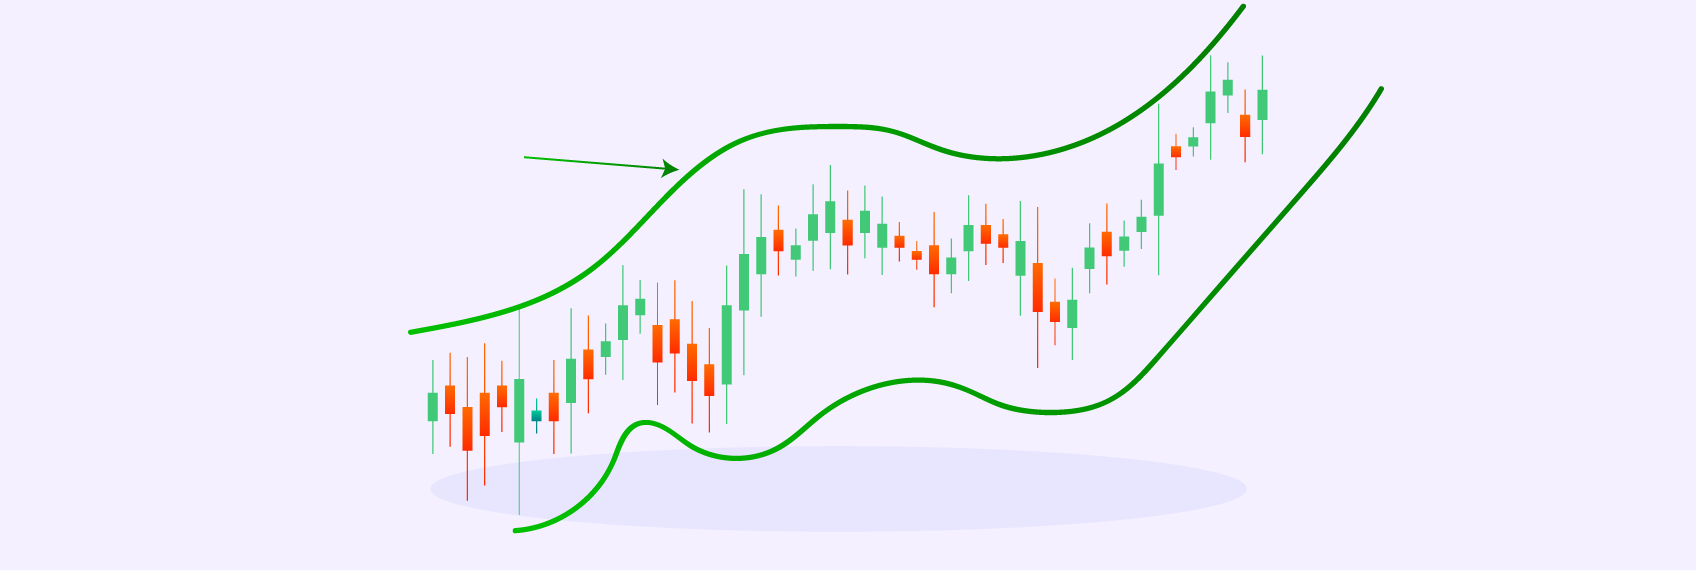
Imagine a highway with lanes marked by the Bollinger Bands. The SMA acts as the centre lane, representing the average price movement. The upper and lower bands depict the standard deviation "lanes" on either side, indicating the typical price range based on historical volatility.
- Contracting Bands: When the upper and lower bands narrow, indicating a contraction, it suggests reduced volatility. This might signal a potential breakout (price moving sharply above or below the bands) in the near future.
- Expanding Bands: Conversely, expanding bands signify increased volatility. This could indicate a trend continuation or a period of heightened price fluctuations.
How to trade with Bollinger Bands?
Bollinger Bands offer various trading signals, but it's crucial to use them in conjunction with other technical indicators and fundamental analysis for confirmation:
- Bollinger Band Squeeze and Breakout: A contraction of the bands followed by a sharp price move above the upper band (bullish breakout) or below the lower band (bearish breakout) can indicate a potential trend continuation.
- Bollinger Band Bounce: If the price reaches the upper or lower band and then reverses direction, it might suggest a potential price reversal. This could be a buying opportunity near the lower band or a selling opportunity near the upper band.
- Bollinger Band Width: The width of the Bollinger Bands can also be informative. A wider band suggests higher volatility, while a narrow band indicates lower volatility. This can help traders adjust their risk management strategies accordingly.
Advanced Bollinger Bands trading strategies
For experienced traders, consider these advanced techniques:
- Bollinger Band Width Percentage: This indicator calculates the percentage difference between the upper and lower bands, offering a more precise measure of volatility changes.
- %B Indicator: This indicator expresses the current price as a percentage of the Bollinger Band range, highlighting potential overbought or oversold conditions.
Important considerations
While valuable, Bollinger Bands have limitations to keep in mind:
- False Signals: Breakouts and bounces don't always guarantee a trend continuation or reversal. Confirmation from other indicators is crucial.
- Lagging Indicator: Bollinger Bands are based on historical data and may not always predict future price movements perfectly.
- Trendless Markets: Bollinger Bands might be less effective in sideways markets with low volatility.
Conclusion
Bollinger Bands are a versatile technical analysis tool that can enhance your trading strategies by providing insights into market volatility and potential breakout opportunities. However, remember that they are just one piece of the puzzle. By combining Bollinger Bands with other indicators, fundamental analysis, and proper risk management, you can make more informed trading decisions and navigate the markets with greater confidence.
Disclaimer: This blog is for informational purposes only and should not be considered financial advice. Always conduct your own research and due diligence before making any trading decisions.