Bollinger Bands are a widely used technical analysis indicator that helps traders gauge market volatility and identify potential options trading opportunities. Invented by John Bollinger, these bands consist of three lines: a simple moving average (SMA) in the centre, and an upper and lower band at a set number of standard deviations above and below the SMA. This blog equips you with the knowledge to effectively utilise Bollinger Bands in your trading strategies.
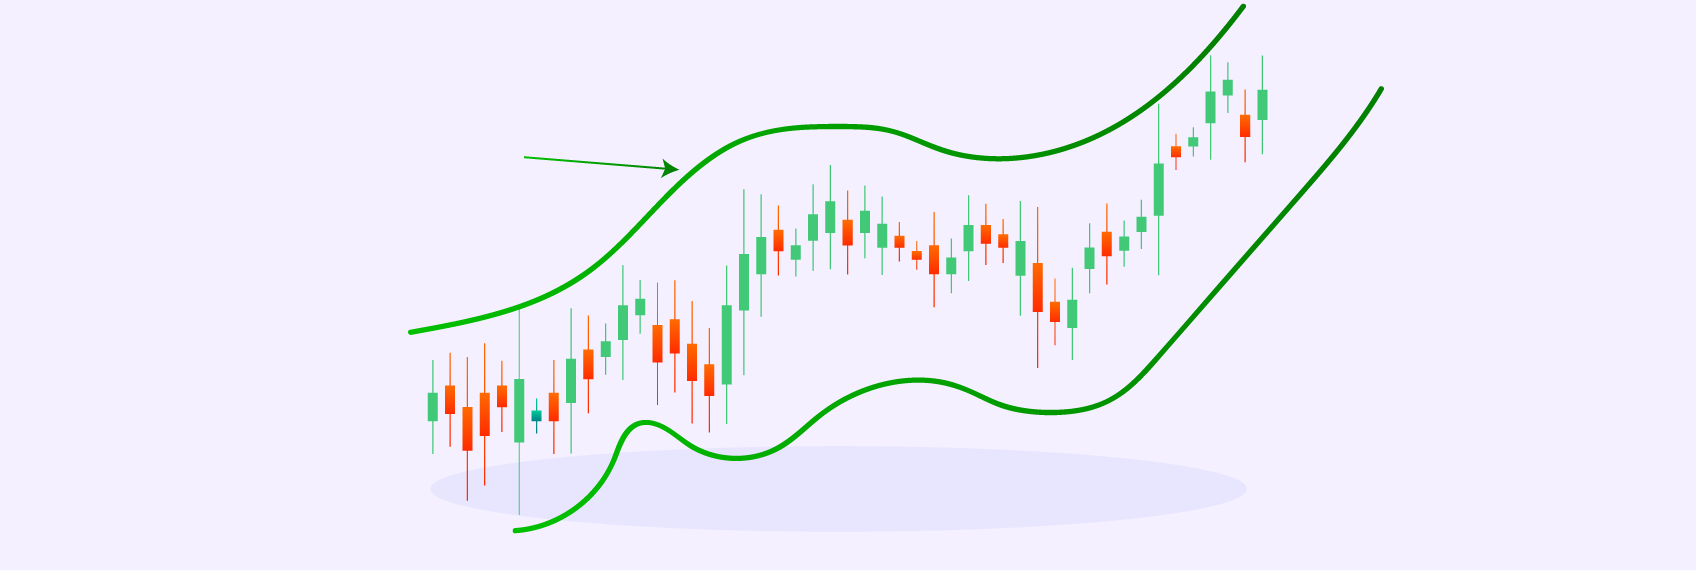
Imagine a highway with lanes marked by the Bollinger Bands. The SMA acts as the centre lane, representing the average price movement. The upper and lower bands depict the standard deviation "lanes" on either side, indicating the typical price range based on historical volatility.
Bollinger Bands offer various trading signals, but it's crucial to use them in conjunction with other technical indicators and fundamental analysis for confirmation:
For experienced traders, consider these advanced techniques:
While valuable, Bollinger Bands have limitations to keep in mind:
Bollinger Bands are a versatile technical analysis tool that can enhance your trading strategies by providing insights into market volatility and potential breakout opportunities. However, remember that they are just one piece of the puzzle. By combining Bollinger Bands with other indicators, fundamental analysis, and proper risk management, you can make more informed trading decisions and navigate the markets with greater confidence.
Disclaimer: This blog is for informational purposes only and should not be considered financial advice. Always conduct your own research and due diligence before making any trading decisions.

Impact of the West Asia War on Crude Oil Prices: An Indian Perspective
2 min Read Mar 13, 2026
The Year-end V-Theory — Will it Play Out Again This Year?
2 min Read Mar 13, 2026
Gold: Tug-of-War Between Safe-Haven Demand and Macro Headwinds
2 min Read Mar 10, 2026
Bullion Demand Surges as Investors Rotate Back to Gold and Silver ETFs Amid Global Uncertainty
2 min Read Mar 10, 2026
NSE to Add Six Stocks to Futures & Options Segment from April 1, 2026
2 min Read Mar 10, 2026
For android only