In the intricate field of technical analysis, not many methods are as interesting and respected as Gann charts. William Delbert Gann, a famous trader, came up with these analytical tools in the early 1900s. They are a striking mix of math, geometry, and market psychology. Gann trading has successfully transcended decades of market evolution, continuing to serve as a valuable framework for analysing price movements and timing within the Indian stock market.
The main thing that makes Gann charts special is that they can show exact links between price and time. In this way, they give traders a way to accurately predict how the market will behave. The Gann indicator is different from regular technical indicators because it looks at time as well as price.
It gives a three-dimensional view of price, time, and patterns that happen over and over again. For people who trade stocks in India, knowing how Gann works means more than just being good at math. It is a philosophical way of trading that takes into account the natural order and cyclical rhythm of the markets.
What is a Gann chart?
A Gann chart is an advanced analytical framework that employs geometric angles and mathematical relationships to anticipate future price movements. The foundation of the chart is the belief that markets move in structured patterns governed by natural laws and mathematical harmony.
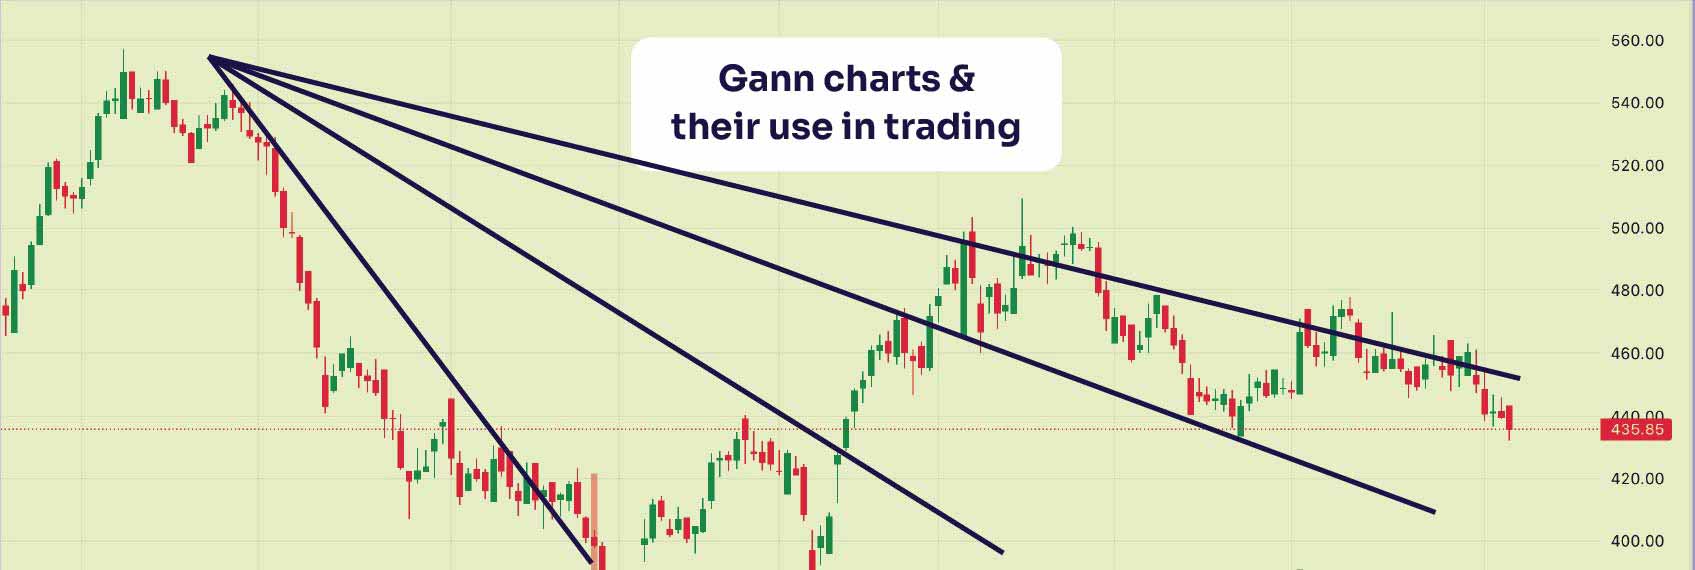
At its most fundamental level, a Gann chart utilises angular relationships between price and time. The most important of these is the 1X1 angle, a 45-degree line where price moves one unit for every unit of time. This balanced relationship is the cornerstone from which all other Gann angles are constructed, including the 2X1, 3X1, 1X2, and 1X3 angles, each representing distinct rates of price movement relative to time.
Constructing Gann charts requires meticulous attention to proportion and scale, ensuring that both price and time are measured equally. This precision allows analysts to identify significant support and resistance levels with mathematical clarity, setting Gann methodology apart from many other technical tools.
Benefits of Gann charts
Gann charts are especially useful for analysing the Indian stock market because of their benefits. Their most unique trait is that they can predict not only direction but also timing. Better market timing: The Gann method looks at how price and time cycles work together to find the best times to buy and sell. This level of timing accuracy is very helpful in the Indian market, which is often very volatile and where small changes in timing can affect profits. Gann charts can be used on a lot of different timeframes, from intraday to multi-year.
This adaptability makes sure that traders can keep their analytical methods the same, no matter what kind of investments they like best. Objective support and resistance: Gann angles give you mathematically derived support and resistance levels that stay the same no matter what happens. This is different from trendlines, which can be open to interpretation. These levels often line up with important changes in the market. Good risk management: The geometric structure of Gann analysis makes it easy to find the right place for a stop-loss.
When a trader breaks through a major Gann angle, it usually means that the trend is changing, which lets them manage risk ahead of time. Better pattern recognition: Gann charts show patterns and cycles that happen over and over again, which might not be visible in regular price charts. This helps traders find market turning points more easily.
Examples of Gann chart application
The practical application of Gann charts in the Indian stock market highlights their reliability.
- Nifty 50 analysis: Consider the Nifty 50 from a significant low of 18,604 in October 2021. By applying a 2X1 Gann angle, a target of 18,341 emerges. When the index met resistance at this level in January 2022 before declining sharply, it demonstrated the predictive strength of the methodology.
- Individual stock analysis: For Tata Motors trading between ₹100 and ₹200, a 1X1 Gann angle from the ₹100 low established multiple support levels. Whenever the stock retraced to this angle and sustained itself above it, the level acted as strong support, enabling subsequent recoveries.
- Sector-wide analysis: Banking indices in India frequently respect Gann angles drawn from major cyclical lows. These provide reliable reference points for traders managing positions in financial stocks.
What is a Gann chart used for?
Gann charts serve multiple analytical purposes, extending beyond simple price forecasting.
- Trend assessment: The relationship between price and different Gann angles indicates trend strength. Trading above the 2X1 angle suggests a strong uptrend, while alignment with the 1X1 indicates balanced conditions.
- Support and resistance forecasting: Gann angles act as dynamic levels that evolve over time, offering greater relevance than static horizontal lines in trending markets.
- Time cycle analysis: By incorporating cycles, Gann methodology helps predict when major price movements are likely to occur.
- Market reversal identification: Breaching significant Gann angles often signals important reversals. According to the rule of all angles, once one angle is penetrated, prices often progress toward the next.
History of Gann charts
William Delbert Gann started coming up with his new ideas in the early 1900s, which is when Gann charts first appeared. Gann was born on June 6, 1878, in Lufkin, Texas. He grew up on a cotton farm and went on to become one of the most respected traders on Wall Street.
He used ideas from math, geometry, astronomy, and old number systems to come up with his method. He learned about ancient math when he travelled to India and Egypt. He later used these ideas in his market analysis methods. Gann started W.D. Gann & Company in New York in 1908. After an amazing demonstration in which he made 286 trades in 25 days, 264 of which were profitable, his trading became well-known. His later works, like Truth of the Stock Tape (1924), laid the groundwork for what is now known as Gann trading.
Who was William Delbert Gann?
Some records mistakenly call William Delbert Gann "Henry Gann." He was a very unusual and talented trader. He was the oldest of eleven children and didn't get much formal schooling, but he was naturally good at math. He started his career at a brokerage firm in Texarkana, where he also worked on improving his theories.
Gann's method combined astrology, astronomy, and geometry with more traditional ways of looking at the market. His religious faith and belief in natural law led him to believe that market movements followed universal rules. Predicting the stock market crash of 1929 may have been his most important accomplishment. Gann said that the market would go down after September 3, and it did, just as he said it would. This made him one of the best market forecasters in history.
Components of Gann charts
Gann charts are composed of several interconnected elements, each serving a distinct analytical role.
- Gann angles: These are angular lines drawn to measure the relationship between price and time. The seven primary angles include 1X8, 1X4, 1X2, 1X1, 2X1, 4X1, and 8X1.
- Gann fan: This displays multiple Gann angles radiating from a significant point, creating a fan-shaped pattern to illustrate potential support and resistance across timeframes.
- Gann square (Square of Nine): This mathematical grid arranges numbers in a spiral sequence to identify significant price levels and time cycles.
- Price plots: Standard price charts provide the base on which Gann methodology is applied, requiring precise scaling for accuracy.
- Swing charts: These highlight essential price movements, filtering out market noise to identify turning points.
- Time cycles: Cyclical studies form a core element, enabling the identification of recurring trends and optimal timing.
Role of Gann charts in investment
Gann methodology holds distinct advantages for investors in the Indian stock market.
- Portfolio timing optimisation: By applying Gann angles to monthly charts, investors can assess whether the market is strengthening, balanced, or weakening.
- Sector rotation strategies: Since the Indian market is often sector-driven, Gann indicators can assist in identifying rotation opportunities and sector-specific timing.
- Risk assessment: By observing when critical angles are breached, investors can adjust portfolios proactively.
- Long-term trend identification: Weekly and monthly analysis provides insights for strategic allocation.
- SIP management: Investors using Systematic Investment Plans can enhance returns by timing additional contributions when markets approach strong support angles.
- Exit strategies: Gann analysis helps identify market tops and reversal zones, supporting disciplined profit booking.
Also read: How to spot profitable trading chart patterns?
Conclusion
Gann charts are a complex method that is still useful in Indian markets today. They give us insights into how the market works that go far beyond what we can get from standard tools by combining geometry, math, and cyclical principles.
The fact that Gann trading still works shows that mathematical relationships in financial markets are always true. The Gann indicator can help traders and investors improve their timing in the market, their risk management, and their decision-making if they are willing to study and use it in a disciplined way. Learning Gann methodology is hard, but the benefits go beyond just making more money.
They include a better understanding of the market's natural flow and the rules that govern how people handle money. As Indian markets grow and develop, Gann charts are still an important tool for any serious analyst. They still show how price, time, and geometry work together in a way that lasts.

Old vs New Tax Regime: ₹20 Lakh Income Can Save You Over ₹1 Lakh
6 min Read Mar 20, 2026
Year-end Stock-taking Ritual for Stock Investors
6 min Read Mar 19, 2026
India's CapEx cycle: key opportunities in infrastructure, capital goods, and power
6 min Read Mar 18, 2026
Domestic liquidity vs FII outflows: what is supporting the Indian equity market?
6 min Read Mar 17, 2026
Tax Saving Deadline March 31: Key Financial Tasks You Must Complete
6 min Read Mar 17, 2026
For android only