Short-term price movements in capital markets, especially in India, are highly volatile. Traders try to interpret the same using technical indicators to provide structure and perspective.
One of the most widely used indicators is the Moving Average. In particular, discussions around the 10-day versus 20-day moving average are common in short-term trading analysis.
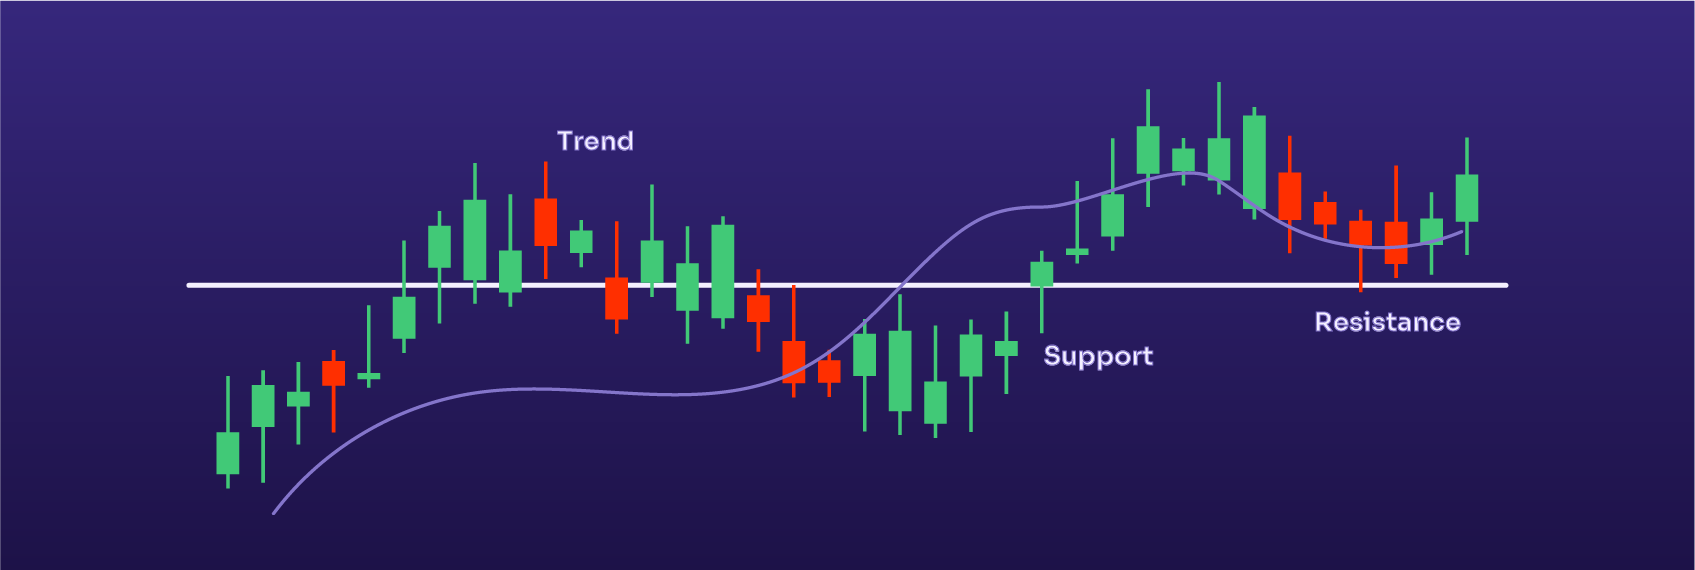
What is a Moving Average?
To calculate the average closing price of a security over a defined period of time, traders use a technical indicator called moving averages.
Each day, the oldest data point is removed and the newest closing price is added. This causes the average to move forward with time, creating a smoother line than raw price data.
In practical use, moving averages help traders to:
- Identify the prevailing price direction
- Observe whether price is trading above or below its recent mean
- Compare shorter and longer averages to assess shifts in momentum
What is the 10-Day Moving Average (DMA)?
The 10-day moving average is a fast moving average because it is based on a smaller number of observations. It reacts more quickly to changes in price. It is, therefore, of particular interest to traders with relatively short holding periods.
For instance, if a mid-capitalisation company trades between ₹500 and ₹520 over 10 sessions, the 10-day moving average is likely to be clustered around ₹510. If the price subsequently jumps to ₹540, the 10-day moving average will adjust quite quickly.
Because of its sensitivity, the 10-day moving average is commonly used as a gauge of changes in recent sentiment. But this sensitivity also leads to frequent fluctuations, particularly in choppy markets.
What is the 20-Day Moving Average (DMA)?
The 20-Day Moving Average (DMA) is also a short-term indicator. It simply uses a longer lookback period. Thus, it smoothes price action more than a 10-day moving average.
In the Indian market, 20 trading sessions are roughly equivalent to a month. Therefore, the 20-Day Moving Average is more useful to visualise larger short-term swings than day-to-day volatility.
A large-cap stock oscillating between ₹1,950 and ₹2,050 over 20 sessions would have the 20-Day Moving Average at the centre of that range. The moving average moves slowly and hence gives a visual point of reference for price action.
10-Day vs 20-Day Moving Average – Key Differences
By default the 10-Day Moving Average uses the last 10 trading days for its calculation. It is a little more sensitive to price activity than the 20-Day Moving Average. Due to this higher sensitivity, it will issue more signals and is often used for a very short-term trading perspective. It is also more susceptible to market noise and short-term market swings.
The 20-Day Moving Average uses the last 20 trading days for its calculation. It will react to price activity slower than the 10-Day Moving Average. Due to this lower sensitivity to price activity, it gives a smoother representation of the trend and is less affected by short-term swings. It is effective for a short-to-near-intermediate-term trading perspective.
10-Day and 20-Day Moving Average Crossover Strategy
A commonly used technique involves observing the interaction between the 10-Day and 20-Day Moving Averages.
When the 10-day moving average line crosses above the 20-day moving average line, it is sometimes interpreted as emerging short-term strength. Conversely, when the 10-day moving average crosses below the 20-day moving average, it may be read as weakening momentum.
It is important to recognise that such crossovers occur after the price has already moved. As lagging indicators, moving averages confirm developments rather than anticipate them.
Conclusion
The 10-day and 20-day moving averages are still a popular tool in Indian equities. They help in smoothing price data, visualising short-term trends and analysing crossovers.
They are based on past data and don’t promise future results. Their use involves interpretation with context, discipline and sound risk management.