To visit the old Ventura website, click here.
Ventura Wealth Clients
By Ventura Research Team 5 min Read
What is the tweezer top candlestick pattern
Share

Tweezer top and bottom candlestick patterns are widely recognised reversal indicators in the field of technical analysis, particularly among traders in the Indian stock market. This article explores the intricate details of the Tweezer Top candlestick pattern—its definition, market psychology, visual characteristics, identification methods, and its significance in trading strategies. You will also gain a deeper understanding of how this formation aligns with prudent technical and regulatory practices in stock trading.

Introduction

The Indian stock market is well known for its volatility and fast-changing price movements. For traders and analysts, such market dynamism calls for precise tools to interpret investor sentiment and identify possible reversals before they fully unfold. Among the many tools of technical analysis, the tweezer candlestick family—comprising both tweezer top and bottom variants—stands out as a visual cue signalling critical turning points.

While the tweezer top pattern serves as a potential bearish reversal signal after a prolonged uptrend, its counterpart, the tweezer bottom, highlights possible bullish reversals following a downtrend. Together, these patterns help traders understand market resistance and support dynamics, which are crucial in planning entries, exits, and risk management.

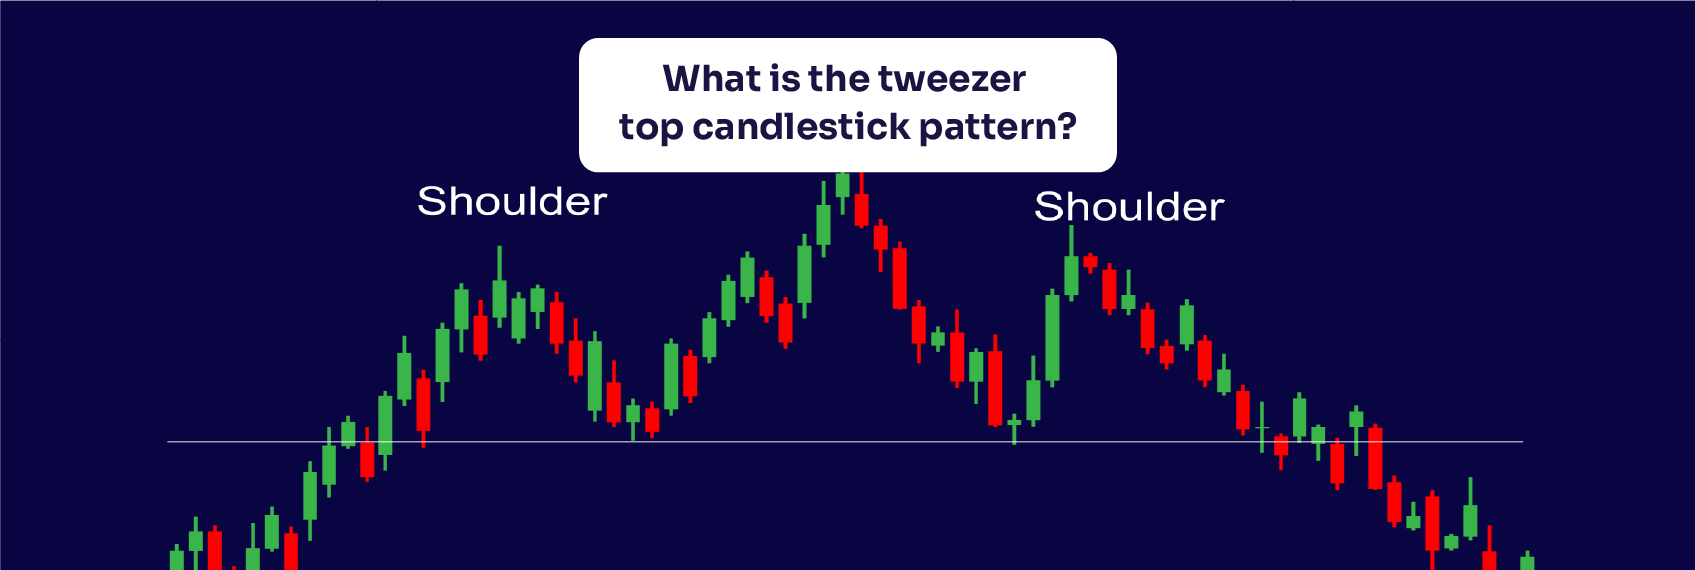
What is the tweezer top candlestick pattern?

A tweezer top candlestick pattern emerges when two consecutive candlesticks in an ongoing uptrend share nearly identical highs. The first candle is typically bullish, representing strong buying interest, while the second is bearish, suggesting selling pressure and a potential reversal in momentum. The dual highs form a visual resemblance to the arms of a pair of tweezers, hence the name.

Essentially, this pattern marks a shift from bullish dominance to bearish intervention. It reflects a moment when buyers attempt to push prices higher but fail to breach an existing resistance level, allowing sellers to regain control. In technical terms, it is considered an early indication of a bearish reversal.

Key characteristics of the tweezer top pattern

The tweezer top candlestick has a distinct structure and occurs under specific market conditions. The following are its defining characteristics:

  • Formation at the peak of an uptrend: This pattern typically appears after a steady rise in the price, indicating potential exhaustion of buying momentum.
  • Matching highs: Both candles exhibit identical or almost identical highs, symbolising a strong resistance area that buyers are unable to overcome.
  • First candle - bullish: The initial candle in the formation shows a confident buying session, closing near the day’s high.
  • Second candle - bearish: The next candle opens around the same level but closes lower, suggesting that sellers have taken command of the price.
  • Potential for trend reversal: The matching tops and shift in sentiment imply that an uptrend may soon turn into a downward move.

CharacteristicTweezer top candle
Trend preceding patternUptrend
Candle 1Bullish with high close
Candle 2Bearish, closes below prior body
HighsMatching or nearly identical
IndicationPossible bearish reversal

How the tweezer top candlestick pattern forms

Understanding the psychology behind the tweezer top pattern can help you in appreciating its importance. It develops through a sequence of market events that demonstrate the struggle between buyers and sellers.

  1. Bullish phase: The first session reflects optimism. Buyers dominate, pushing prices upward and forming a strong bullish candle at the top of the swing that closes near its high.
  2. Bearish shift: In the next session, the market opens near the same high, but the upward momentum quickly fades. Sellers enter the scene, rejecting further price advancement.
  3. Resistance confirmation: The second candle fails to exceed the previous high, resulting in nearly identical tops on both candles. This confirms a key resistance point.
  4. Reversal potential: The price eventually closes lower, signalling the start of a potential downward correction.

Interpretation of the tweezer top pattern

A tweezer top candlestick pattern serves as a reflection of price fatigue. When two consecutive candles display matching highs, it often means that the ongoing uptrend is losing steam. The resistance level at the top of the candles highlights the psychological barrier that buyers fail to surpass. Consequently, traders may interpret this as a signal that selling pressure is about to increase.

However, while the pattern suggests the likelihood of a reversal, it should never be viewed in isolation. Seasoned analysts confirm its validity by examining supporting signals, such as volume spikes, moving average crossovers, or oscillators like RSI and MACD. These complementary tools help validate the authenticity of the reversal and align with sound trading discipline.

Example of the tweezer top pattern in a real market scenario

Suppose a stock listed on the Indian stock exchanges has been moving upward for several sessions. On the candlestick chart:

  • Day 1 (October 10, 2025): A bullish candle forms, closing at ₹2,350 after testing that level as the day’s high.
  • Day 2 (October 11, 2025): The stock again reaches ₹2,350 but fails to close higher, ending the session at ₹2,320 with a bearish candle.

This results in a tweezer top pattern, revealing that the market tested resistance twice but could not break it. The repeated failure to cross ₹2,350 signals emerging selling pressure and a possible reversal.

DateCandle TypeOpenHighLowClose
October 10, 2025Bullish2,3202,3502,3102,350
October 11, 2025Bearish2,3402,3502,3152,320

Such examples, when plotted on a candlestick chart, provide visual evidence of resistance levels where momentum begins to fade.

Difference between tweezer top and tweezer bottom patterns

While both patterns belong to the same candlestick family, their implications differ significantly.

FeatureTweezer TopTweezer Bottom
Location on chartEnd of uptrendEnd of downtrend
Technical indicationBearish reversalBullish reversal
Candle 1BullishBearish
Candle 2Bearish (matching high)Bullish (matching low)
InterpretationSellers overpower buyersBuyers overpower sellers

Understanding both variations enables traders to spot reversal opportunities in both bullish and bearish market conditions.

How to trade using the tweezer top candlestick pattern

Traders often use the tweezer top candlestick as a signal to prepare for short positions or to exit long positions. Here are a few practical considerations:

  1. Confirm the existing uptrend: The reliability of the pattern improves when it occurs after a well-defined uptrend.
  2. Monitor trading volume: Increased volume during the second (bearish) candle strengthens the case for a reversal.
  3. Seek confluence: Combine this signal with other indicators such as the Relative Strength Index (RSI), Moving Average Convergence Divergence (MACD), or trendline resistance for stronger validation.
  4. Manage risk: Implement stop-loss orders to protect against false breakouts or short-lived reversals.

While the tweezer top candle may indicate a shift in sentiment, it should never be used in isolation to make trading decisions. A disciplined approach that integrates risk control and technical validation remains essential.

Common mistakes to avoid when trading the tweezer top pattern

Even experienced traders occasionally misinterpret the tweezer top candlestick pattern. Some common pitfalls include:

  • Ignoring the trend: The pattern is only meaningful after a clearly established uptrend.
  • Forcing identification: Not all matching highs qualify as a tweezer top; context is crucial.
  • Neglecting volume: Without adequate volume confirmation, the pattern’s reliability decreases.
  • Overlooking stop-losses: Poor risk management can lead to unnecessary losses.

Avoiding these mistakes can help traders interpret the tweezer top chart with greater accuracy and confidence.

Advantages and limitations of the tweezer top candlestick pattern

Advantages

  • Straightforward and visually easy to identify.
  • Offers an early warning of potential reversals.
  • Works effectively when combined with other indicators.

Limitations

  • Can produce misleading signals in volatile or low-volume markets.
  • Requires confirmation for accuracy.
  • Does not guarantee an immediate trend reversal.

By understanding both its strengths and weaknesses, traders can use the tweezer top pattern more responsibly within their overall trading framework.

Tweezer top pattern versus other bearish reversal patterns

PatternKey FeatureReliabilityWhen Spotted
Tweezer TopTwo candles with matching highsModerateDuring uptrend near resistance
Bearish EngulfingBearish candle engulfs prior bullish candleHighAfter uptrend
Shooting StarSingle candle with long upper shadowModerateAt the peak of an uptrend
Evening StarThree-candle reversal combinationHighAt the end of an uptrend

Each bearish reversal formation offers a distinct interpretation of market behaviour. The tweezer top candlestick stands out for its visual simplicity and clarity, making it particularly useful for novice traders when used alongside confirmation tools.

Conclusion

The tweezer top candlestick pattern is an essential concept in technical analysis and a widely observed formation among Indian traders. Its appearance at the end of an uptrend often hints at a weakening bullish sentiment and the possible onset of a bearish phase. By recognising the matching highs that characterise this pattern, traders can better assess resistance levels and prepare for market shifts.

Nevertheless, one must remember that no candlestick pattern operates in isolation. The tweezer top pattern should be verified with additional technical indicators, sound risk management, and awareness of broader market conditions. Used judiciously, it can serve as a valuable tool for enhancing trading precision and discipline.

This article is intended solely for educational purposes and does not constitute financial advice. Investors are encouraged to consult certified financial experts and adhere to stock broking regulations before making investment decisions.