Technical analysis relies on a vast toolbox of indicators and strategies to help traders navigate the ever-changing market landscape. Among these, the Fibonacci Retracement strategy stands out as a popular and versatile technique for identifying potential support and resistance levels. This blog delves into the fascinating world of Fibonacci ratios, their application in trading, and how you can leverage the Fibonacci Retracement strategy to make informed trading decisions.
What is a Fibonacci sequence?
The Fibonacci sequence is a mathematical series where each number is the sum of the two preceding numbers (0, 1, 1, 2, 3, 5, 8, 13, 21, etc.). This seemingly simple sequence holds surprising relevance in the financial world. Fibonacci retracements are based on key ratios derived from this sequence, such as 23.6%, 38.2%, 50%, 61.8%, and 100%.
Fibonacci retracement levels
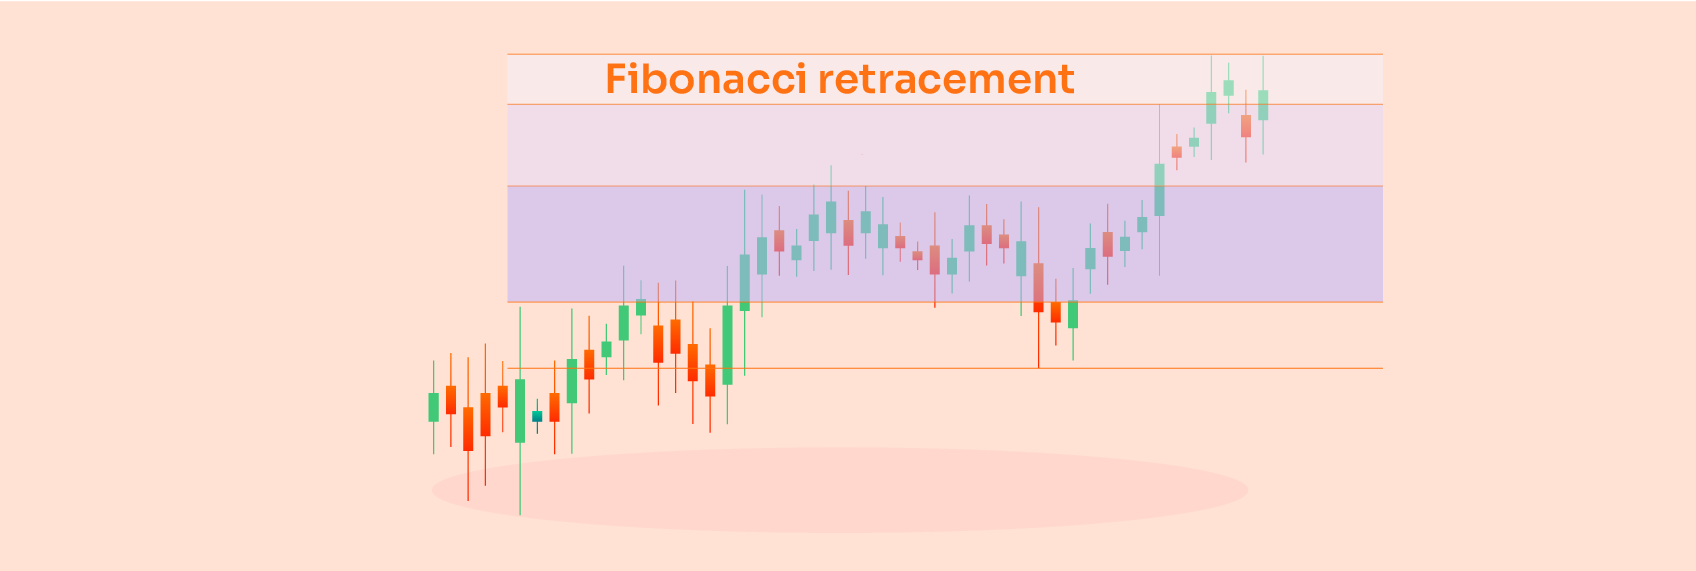
The Fibonacci Retracement strategy posits that after a strong price move (either up or down), the price is likely to retrace (pull back) to certain Fibonacci levels before continuing its original trend. These retracement levels are believed to represent areas of potential support (for uptrends) or resistance (for downtrends) where buyers or sellers may re-enter the market.
Fibonacci retracement strategy
Most charting platforms offer a Fibonacci Retracement tool. Here's how to use it:
- Identify a Swing High and Swing Low: For an uptrend, locate the most recent swing high and the preceding swing low. For a downtrend, identify the most recent swing low and the preceding swing high.
- Draw the Fibonacci Retracement Lines: Extend the Fibonacci retracement tool from the swing high to the swing low. This will automatically generate horizontal lines at the key Fibonacci ratios (23.6%, 38.2%, etc.) across the price chart.
Interpreting the Fibonacci retracement levels
- Potential Support: In an uptrend, the retracement levels, particularly 38.2% and 61.8%, might act as support zones where the price might find buyers and bounce back up, continuing the uptrend.
- Potential Resistance: In a downtrend, the retracement levels, especially 38.2% and 61.8%, might act as resistance zones where the price might encounter selling pressure and resume its downward trend.
Trading with the Fibonacci retracement strategy
Here are some pointers for incorporating Fibonacci retracements into your trading strategy:
- Confirmation with Other Indicators: While Fibonacci retracements offer valuable insights, they shouldn't be used in isolation. Combine them with other technical indicators like price patterns or moving averages for confirmation.
- Price Action is Key: Observe price action around the retracement levels. A clear bounce or rejection at a level strengthens its significance.
- Volatility Matters: The effectiveness of Fibonacci retracements can be diminished in highly volatile markets.
Limitations of the Fibonacci retracement strategy
- Self-Fulfilling Prophecy: If enough traders rely on Fibonacci retracements, their buying or selling behaviour at these levels can influence price action, potentially creating a self-fulfilling prophecy.
- Not Guaranteed: Fibonacci retracements are probabilistic, not guarantees. Prices may not always retrace to these levels, and breakouts can occur.
Conclusion
The Fibonacci Retracement strategy offers a valuable tool for options trading to identify potential support and resistance zones. However, it's crucial to remember that it's not a foolproof method. By combining Fibonacci retracements with other technical analysis tools, sound risk management practices, and a healthy dose of scepticism, you can enhance your ability to make informed trading decisions and navigate the dynamic world of financial markets. Remember, successful trading requires a confluence of factors, and the Fibonacci Retracement strategy is a powerful piece of the puzzle, not the puzzle itself.